

The S&P 500 index jumped over 2% on Friday, after a fall into the correction zone on Thursday last week, whereas the Nasdaq continues to be in the correction territory. While technical analysis points toward bearish trends, this analyst says that investors can start looking for buy signals.
What Happened: As of Friday, the S&P 500 index was 8.27% down from its 52-week high, which followed a bounce from Thursday’s 10.18% drawdown. Similarly, Nasdaq 100 was 11.33% lower from its 52-week high as of Friday.
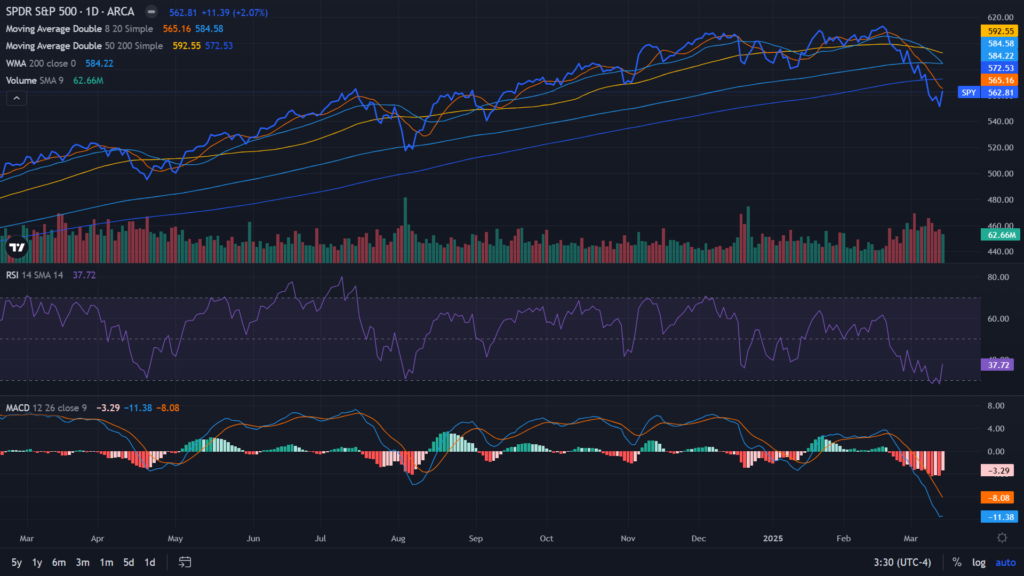
According to Benzinga Pro and Edge Rankings, the technical analysis of the exchange-traded fund tracking the S&P 500 index, SPDR S&P 500 ETF Trust SPY were flashing warning signals.
Don't Miss:
- Maker of the $60,000 foldable home has 3 factory buildings, 600+ houses built, and big plans to solve housing — you can become an investor for $0.80 per share today.
- If there was a new fund backed by Jeff Bezos offering a 7-9% target yield with monthly dividends would you invest in it?
Despite that Jay Kaeppel, the senior market analyst at SentimenTrader via his Panic/Euphoria analysis model showed that the S&P 500’s decline was still not flashing a buy signal. However, from this point, investors could "Start looking for a buy signal".
According to the chart shared by him, when the Panic/Euphoria line falls below the Excessive Pessimism level, investors could expect a bounce back with an average of over 7% return after two months and 28% returns after a year. But, this follows a series of red dots representing that investors should take a backseat.
Hence, as his model shows the presence of only one red dot, Kaeppel doesn’t forecast a buy yet, but the start of a potentially emerging buy signal.
See Also: Wondering if your investments can get you to a $5,000,000 nest egg? Speak to a financial advisor today. SmartAsset’s free tool matches you up with up to three vetted financial advisors who serve your area, and you can interview your advisor matches at no cost to decide which one is right for you.
Why It Matters: SPY fell below its 200-day moving average on Thursday after its longest-ever streak and its technical charts showed that it was below all its short and long-term moving averages. The MACD momentum indicator was negative 11.38, signaling a downtrend in the short-term and its relative strength index of 37.72 was in the neutral zone.
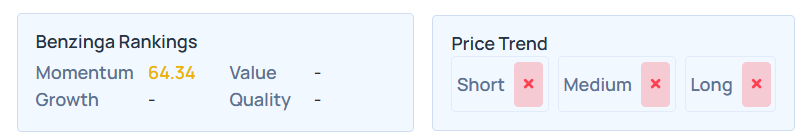
Similarly, the Edge Rankings showed that SPY had a poor price trend in short, medium, and long term, with a momentum ranking of 64.34 percentile.
Read Next:
- Many don’t know there are tax benefits when buying a unit as an investment — Here’s how to invest in real estate by mirroring BlackRock's big move
- Tired of waiting on the sidelines? With Groundfloor, you can invest in real estate projects with as little as $10 — no accredited investor status required.
Photo courtesy: Shutterstock
Edge Rankings
Price Trend
© 2025 Benzinga.com. Benzinga does not provide investment advice. All rights reserved.
Trade confidently with insights and alerts from analyst ratings, free reports and breaking news that affects the stocks you care about.

