


Zinger Key Points
- JD stock forms a Death Cross, signaling potential bearish momentum as Walmart plans to sell its stake.
- Technical indicators suggest JD.com faces selling pressure, with most moving averages showing bearish signals.
- Feel unsure about the market’s next move? Copy trade alerts from Matt Maley—a Wall Street veteran who consistently finds profits in volatile markets. Claim your 7-day free trial now.
JD.com Inc. JD stock has entered bearish territory, with a Death Cross signaling a potential downturn. The e-commerce giant is down 1.16% year-to-date and 20.51% over the past year, though it saw a slight uptick of 2.6% in the past month.
The recent sell-off by Walmart Inc. WMT only adds to the uncertainty, as the retail behemoth announced plans to offload its stake in JD, aiming to raise up to $3.74 billion. This strategic move comes as Walmart shifts focus to its own operations in China, leaving JD to grapple with the market’s reaction.
Walmart’s Exit Shakes JD Stock
Walmart’s decision to sell its JD stake follows a stellar earnings report.
Exceeding expectations on both earnings per share (reported 67 cents vs. 64 cents expected) and sales ($169.33 billion vs. $168.56 billion), Walmart has captured analysts’ attention with market share gains and improving gross margins.
In contrast, JD now faces the challenge of maintaining investor confidence amid this significant stakeholder exit.
JD Stock Chart – Indicators Signal Trouble
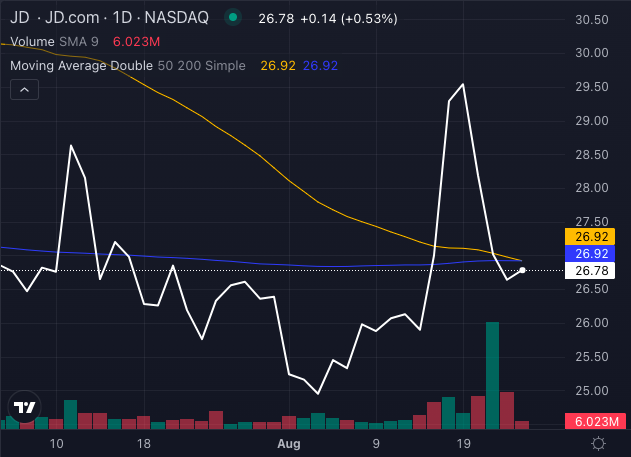
Chart created using Benzinga Pro
JD stock’s Death Cross, where the 50-day moving average crosses below the 200-day moving average, suggests bearish momentum ahead.
Technical indicators further confirm the bearish trend. The stock is currently trading below its five, 20 and 50-day exponential moving averages, signaling strong selling pressure.
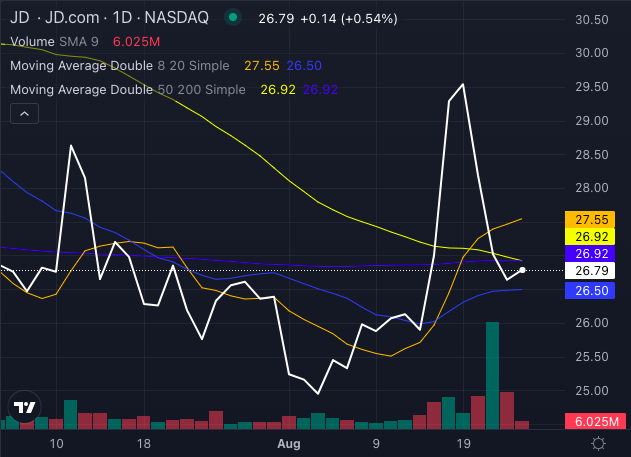
Chart created using Benzinga Pro
The share price of $26.79, below the 8-day simple moving average of $27.55, generates a clear bearish signal.
However, the stock is trading slightly above its 20-day SMA of $26.50, hinting at a brief bullish opportunity.
Yet, with the 50-day SMA at $26.92 and the 200-day SMA at $26.92, both above the current price, the broader outlook remains grim.
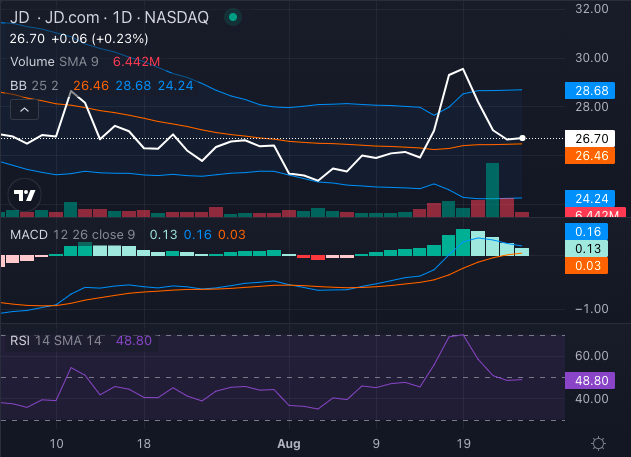
Chart created using Benzinga Pro
The Moving Average Convergence Divergence (MACD) indicator at 0.16 suggests a bullish sentiment, but the Relative Strength Index (RSI) of 48.80, indicates that JD stock is in a neutral zone, reflecting a lack of clear momentum instead of pointing to an oversold or overbought market condition.
Bollinger Bands also paint a bearish picture, with JD stock having traded mostly in the lower band. The stock did jump briefly to the upper band on the earnings beat, however, it appears to be now treading back to the lower band, reinforcing the bearish signals.
What's Next For JD Stock?
With Walmart's exit and technical indicators flashing warning signs, JD stock could face a challenging road ahead.
Investors should brace for potential volatility as the company navigates these bearish waters.
Read Next:
Photo: Shutterstock
Edge Rankings
Price Trend
© 2025 Benzinga.com. Benzinga does not provide investment advice. All rights reserved.
Trade confidently with insights and alerts from analyst ratings, free reports and breaking news that affects the stocks you care about.

