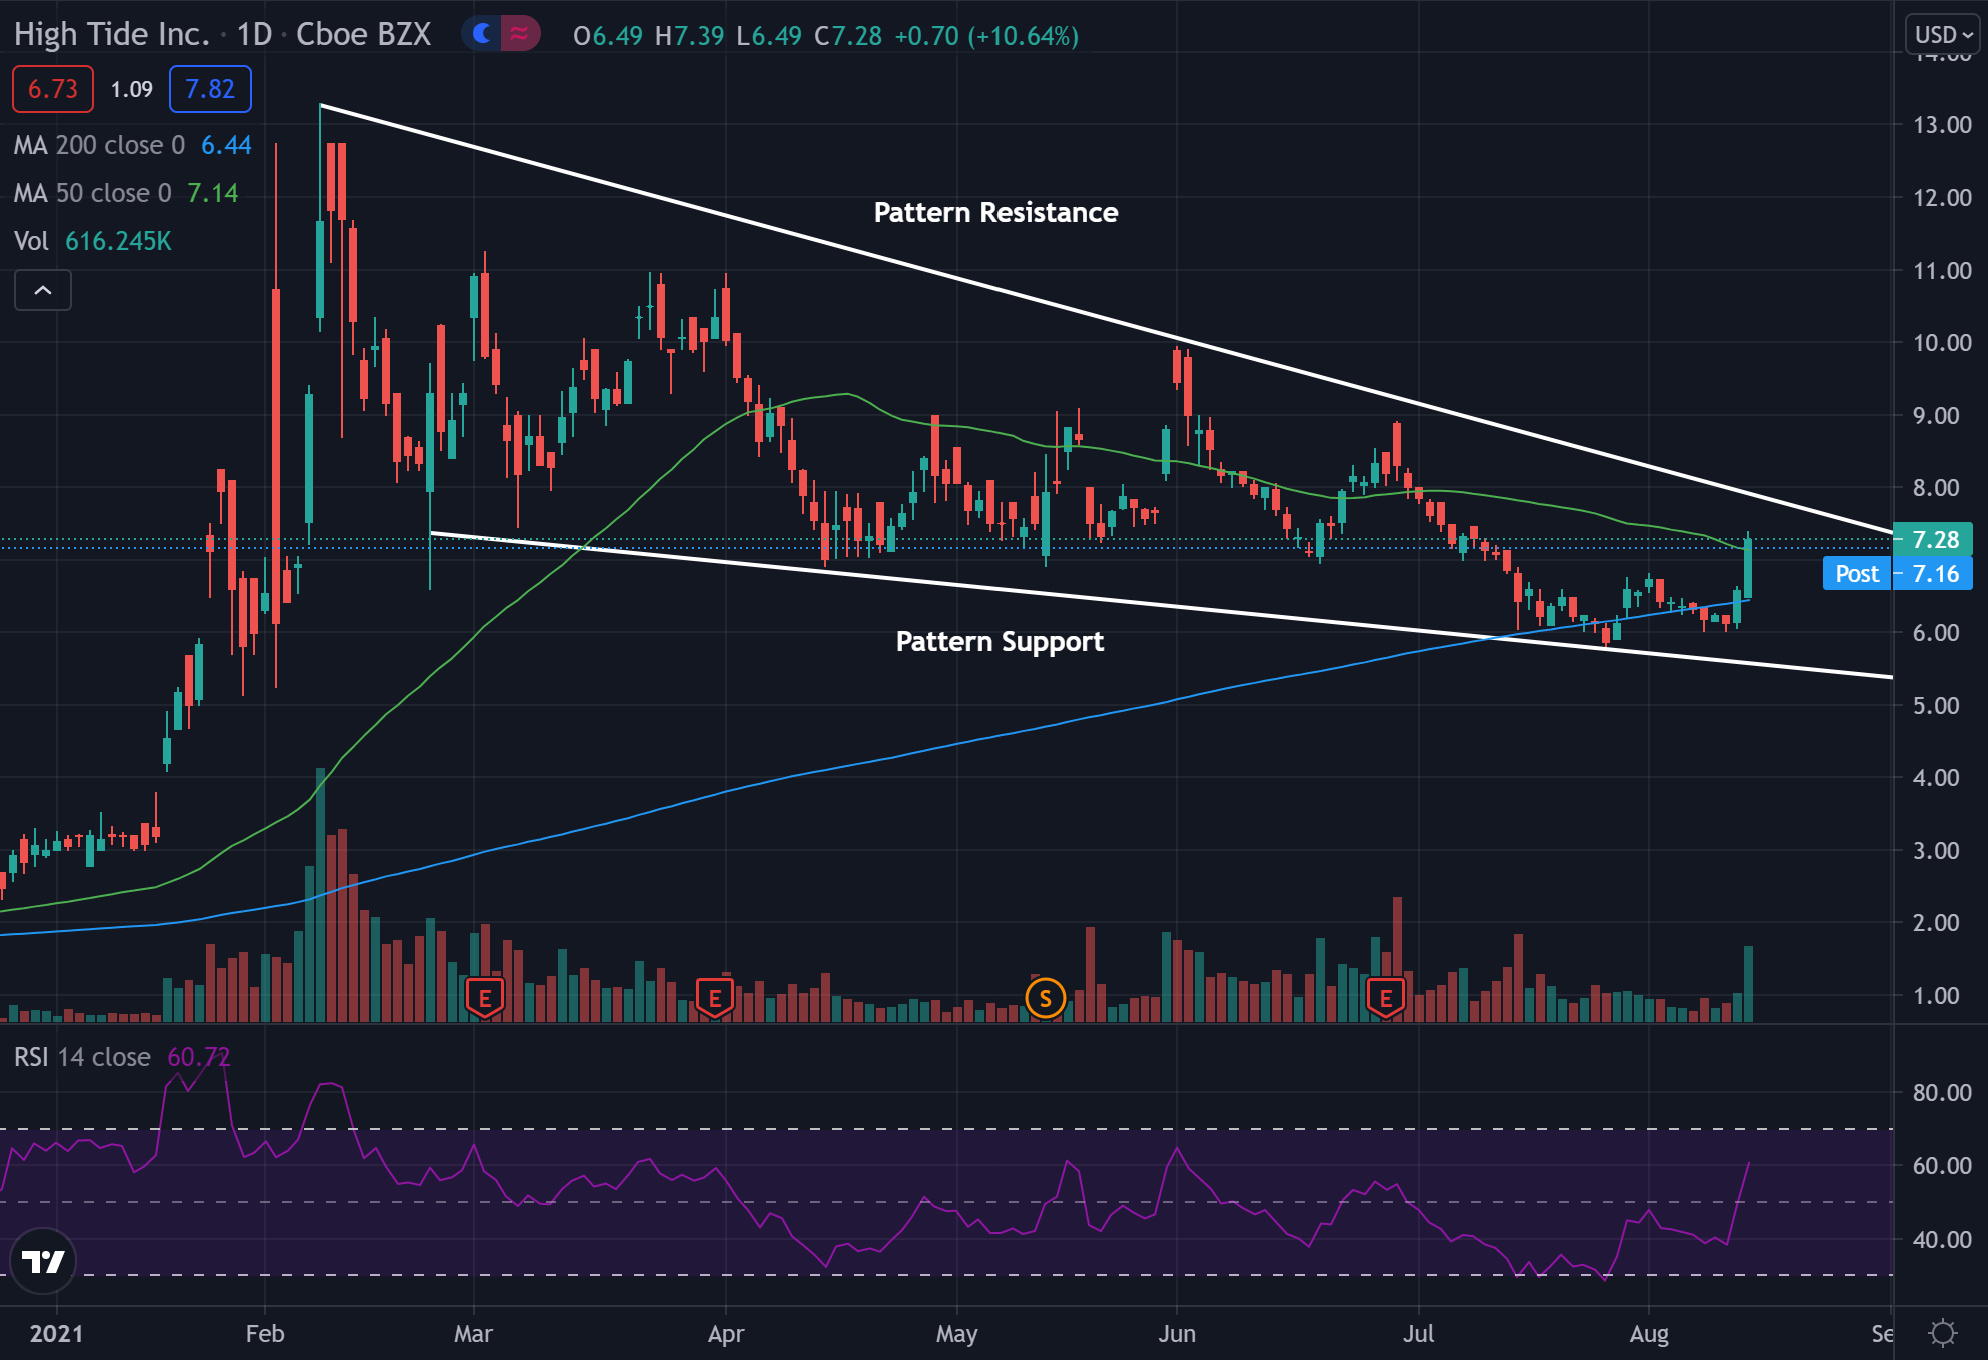
High Tide Inc. HITI shares are trading higher Friday, likely on continued momentum after the company closed an acquisition deal for the online e-commerce platform DankStop.
High Tide closed Friday's session 11.09% higher at $7.31.
High Tide Daily Chart Analysis
-
The stock looks like it has broken out of what technical traders call a falling wedge pattern.
- The stock trades above both the 50-day moving average (green), and the 200-day moving average (blue), indicating recent sentiment in the stock has been bullish.
- Each of these moving averages may hold as a possible area of support in the future.
- Price has been pushing higher inside of the wedge pattern and could see a breakout if it continues higher.
- The Relative Strength Index (RSI) has been moving upward and now sits at 60. This shows that there was an increase in buyers throughout the past few days.

What’s Next For High Tide?
Bullish traders are looking to see the stock break above pattern resistance and continue to move higher. Bulls would then want to see consolidation after a breakout for a possible further move.
Bearish traders would like to see the stock fall below pattern support and below the moving averages for a potential change in trend and sentiment.
Edge Rankings
Price Trend
© 2025 Benzinga.com. Benzinga does not provide investment advice. All rights reserved.
Trade confidently with insights and alerts from analyst ratings, free reports and breaking news that affects the stocks you care about.
Cannabis is evolving—don’t get left behind!
Curious about what’s next for the industry and how to stay ahead in today’s competitive market?
Join top executives, investors, and industry leaders at the Benzinga Cannabis Capital Conference in Chicago on June 9-10. Dive deep into market-shaping strategies, investment trends, and brand-building insights that will define the future of cannabis.
Secure your spot now before prices go up—this is where the biggest deals and connections happen!