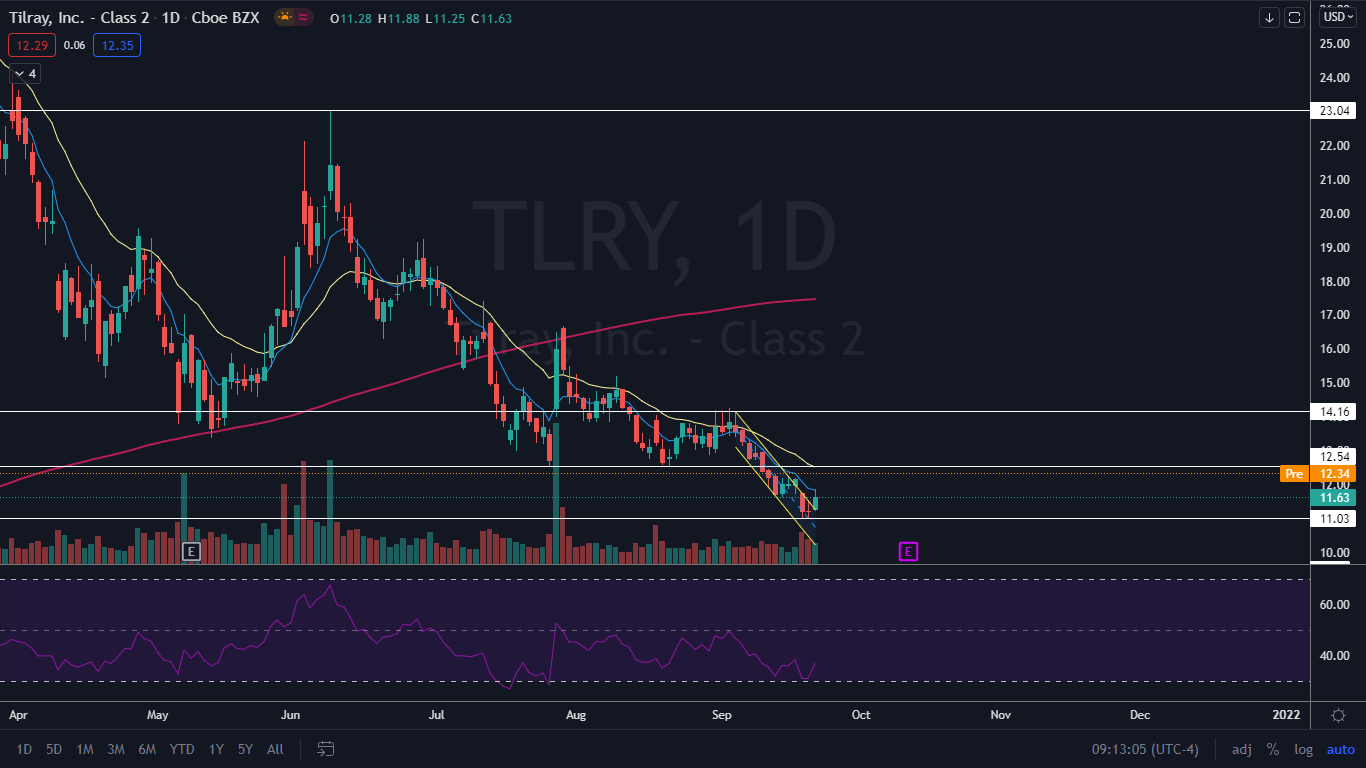
Tilray Inc TLRY on Wednesday broke up bullishly from a descending channel that had been holding the stock down since Sept. 3. Tilray’s stock attempted to break from the same channel on Sept. 17, but was brought back down the following day amid overall market weakness, which resulted in a bull trap.
The stock was trading 6% higher in Thursday's premarket session. An options trader may have recognized some bullish indicators on Tilray’s stock and at 10:13 a.m. Wednesday purchased 616 call contracts at 71 cents per piece with a strike price $12 and an October 15 expiry. The order cost the trader a total of $43,736.
See Also: Cannabis Market in the US Shows Signs of Movement Toward High-Quality Sector
The Tilray Chart: Tilray has been trading in a downtrend making a series of higher highs and higher lows. On Tuesday and Wednesday Tilray’s stock tested a support level near the $11 mark and held above it, which created a bullish double bottom pattern.
The price action also brought Tilray’s relative strength index (RSI) to the 30% level. When a stock’s RSI reaches or exceeds the level, it becomes oversold which is a buy signal for technical traders.
Tilray is trading below the eight-day and 21-day exponential moving averages (EMAs) with the eight-day EMA trending below the 21-day, both of which are bearish indicators. On Wednesday Tilray attempted to regain the eight-day EMA as support but rejected and wicked from the level. The stock is trading below the 200-day simple moving average, which indicates overall sentiment is bearish.
- Bulls want to see Tilray’s stock open the trading session above the eight-day EMA and for big bullish volume to pop the stock up over a resistance level at $12.54. If the stock can regain the level as support, it has room to move up over the 21-day EMA. If Tilray can hold above the level the eight-day EMA will eventually cross back above the 21-day, which would give bulls more confidence going forward.
- Bears want to see big bearish volume come into Tilray to drop the stock back down into the descending channel, which would cause the stock to lose the key support level at $11.03. Below the area, there is further support down at $9.51.

© 2025 Benzinga.com. Benzinga does not provide investment advice. All rights reserved.
Trade confidently with insights and alerts from analyst ratings, free reports and breaking news that affects the stocks you care about.