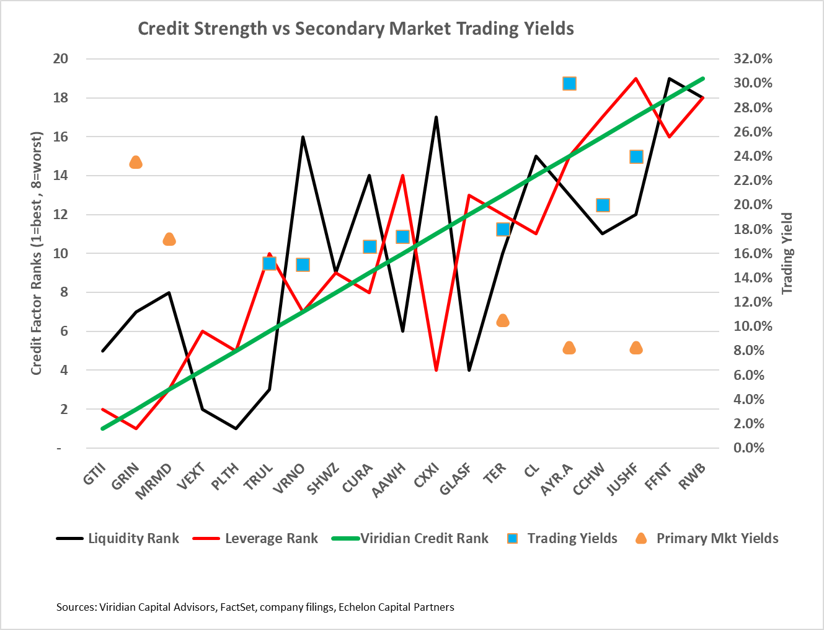
The chart shows Viridian Capital Advisors Credit Tracker rankings of credit quality for nineteen public U.S. cannabis companies with market caps over $25M, along with the offered-side trading yield of the company’s debt (blue squares) or the effective cost at the closing of the company’s 2023 debt issue (orange triangle). Two companies, Columbia Care CCHWF and Trulieve TRUL, have more than one trading bond, and we have chosen the one with the lowest offered yield, corresponding to the shortest maturity in each case.

Investors are struggling to decide if the cannabis equity market has finally bottomed. The MSOS has been trading in the $5-6 range since April leading investors to become more comfortable with the idea, but nagging doubts remain. Equity analysts have reduced 2023 EBITDA estimates for the top 10 MSOs by 22% since the beginning of the year, and Q2 23 aggregate EBITDA for the group is expected to be nearly 10% lower than Q2 22. SAFE and rescheduling appear possible but uncertain. Investors are left wondering where and how to ride out the storm. Viridian suggests investors look at the senior secured cannabis debt market. Stronger credits like Trulieve, Verano VRNOF, and Curaleaf CURLF are trading between 15% and 16.5%, while weaker credits like AYR AYRWF, Columbia Care, and Jushi JUSHF trade from 20% to 30%.
The graph shows that the pricing of cannabis debt in the secondary market generally follows the Viridian Capital Credit Tracker credit rankings. The Viridian system can be an important tool to spot pricing inefficiencies. For example, the AYR 12.5% notes of December 2024 are offered at a 30% yield, over 600bp higher than Columbia Care or Jushi NEO, two companies we view as worse credits. Columbia Care bonds benefit from the company’s moves to entice holders to exchange into lower coupon longer maturity bonds, and we believe similar moves by AYR to refinance or extend maturities will highlight the attractiveness of the AYR bonds.
The orange triangles in the top left of the chart show that small companies or small issues tend to have higher effective costs even if they have good credit quality. For instance, Grown Rogue is among the top credit quality companies in the industry, but it had to pay a 23.5% effective yield to sell a $5M debt tranche. Similarly, MariMed issued debt earlier in the year with an effective cost of over 17% despite its outstanding credit quality. Investors may be able to achieve higher risk-adjusted returns in smaller names.
The orange triangles on the lower right point out one of the ways higher-risk companies are reducing interest costs and improving liquidity. AYR Wellness received an 8.26% mortgage for its Gainesville cultivation facility while its public bonds were being traded at distressed levels. Similarly, Jushi obtained a 5-year 8.25% loan from FVCbank, while its public bonds were yielding low at 20%. TerrAscend TSX, a better credit, secured a 10.5% financing from Needham Bank during the same week that it paid effective yields of 17.34% on a private placement. Regional banks will likely continue to edge into cannabis lending, offering benefits for lower-tier cannabis credits.
Cannabis investors should diversify their portfolios with debt. The debt on the chart will not produce the doubling or tripling of money investors hope to achieve from cannabis equities, but these positions are significantly less risky. And getting paid 15-20% to see if this is the bottom isn’t so bad, is it? Remember, those equity doubles cannot happen unless these bonds get paid first.
The Viridian Capital Chart of the Week highlights key investment, valuation and M&A trends taken from the Viridian Cannabis Deal Tracker.
The Viridian Cannabis Deal Tracker provides the market intelligence that cannabis companies, investors, and acquirers utilize to make informed decisions regarding capital allocation and M&A strategy. The Deal Tracker is a proprietary information service that monitors capital raise and M&A activity in the legal cannabis, CBD, and psychedelics industries. Each week the Tracker aggregates and analyzes all closed deals and segments each according to key metrics:
-
Deals by Industry Sector (To track the flow of capital and M&A Deals by one of 12 Sectors - from Cultivation to Brands to Software)
-
Deal Structure (Equity/Debt for Capital Raises, Cash/Stock/Earnout for M&A) Status of the company announcing the transaction (Public vs. Private)
-
Principals to the Transaction (Issuer/Investor/Lender/Acquirer) Key deal terms (Pricing and Valuation)
-
Key Deal Terms (Deal Size, Valuation, Pricing, Warrants, Cost of Capital)
-
Deals by Location of Issuer/Buyer/Seller (To Track the Flow of Capital and M&A Deals by State and Country)
-
Credit Ratings (Leverage and Liquidity Ratios)
Since its inception in 2015, the Viridian Cannabis Deal Tracker has tracked and analyzed more than 2,500 capital raises and 1,000 M&A transactions totaling over $50 billion in aggregate value.
The preceding article is from one of our external contributors. It does not represent the opinion of Benzinga and has not been edited.
© 2025 Benzinga.com. Benzinga does not provide investment advice. All rights reserved.
Trade confidently with insights and alerts from analyst ratings, free reports and breaking news that affects the stocks you care about.
Cannabis is evolving—don’t get left behind!
Curious about what’s next for the industry and how to stay ahead in today’s competitive market?
Join top executives, investors, and industry leaders at the Benzinga Cannabis Capital Conference in Chicago on June 9-10. Dive deep into market-shaping strategies, investment trends, and brand-building insights that will define the future of cannabis.
Secure your spot now before prices go up—this is where the biggest deals and connections happen!