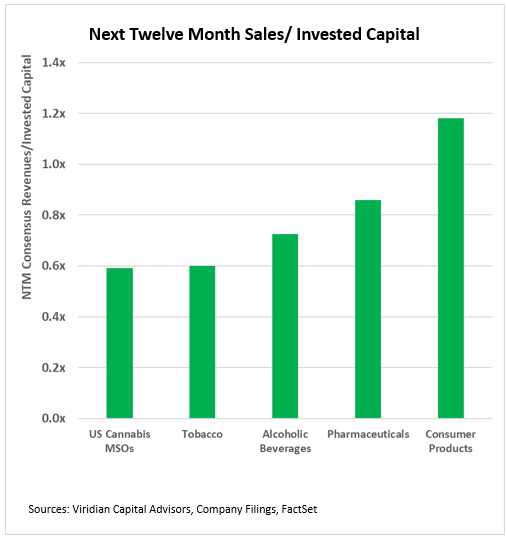
The chart explores the capital intensity of cannabis compared to four other industries thought to be likely suitors for cannabis companies upon federal legalization: Tobacco, Alcoholic Beverages, Pharmaceuticals, and Consumer Products.

In the chart, the cannabis group comprises the nine MSOs with market caps over $100M.
Tobacco includes British American Tobacco BTI, Altria MO, Phillip Morris International PM, and Japan Tobacco JAPAF.
Alcoholic Beverages include ABEV ABEV, Brown-Forman (NYSE: BF-B), Constellation Brands STZ, Diageo DEO, and Molson Coors TAP.
Pharmaceuticals include Johnson & Johnson JNJ, Pfizer PFE, Merck & CO. MRK, and Eli Lilly LLY.
Consumer Products include Colgate Palmolive CL, Mondeles MDLZ, Proctor & Gamble PG, and Unilever UL.
The capital intensity of each group (depicted by the green bar) is measured by its aggregate next twelve-month consensus revenue estimates divided by aggregate capital employed (book equity + total debt –cash). The lower the bar, the more capital the industry requires to generate $1 in sales.
The chart shows that cannabis is the most capital-intensive of the industries shown.
NYU professor Aswath Damodaran publishes an annual study of approximately 7,000 companies in 94 industries, and only 16 of the 94 industries are more capital-intensive than cannabis. (Damodaran does not include cannabis in his studied industries.)
Cannabis capital intensity is related to federal illegality. Cannabis companies must cultivate cannabis in each state where they sell the product, an economically inefficient practice. Post-legalization, we would expect a more centralized or at least regionalized structure to develop. Similarly, cannabis companies are forced to maintain duplicate managerial and operations functions that would be eliminated in an interstate commerce environment.
Like 280e, excess capital intensity is an economic burden imposed on cannabis, the removal of which we expect to improve cannabis economics and cash flow- eventually.
The Viridian Capital Chart of the Week highlights key investment, valuation and M&A trends taken from the Viridian Cannabis Deal Tracker.
The Viridian Cannabis Deal Tracker provides the market intelligence that cannabis companies, investors, and acquirers utilize to make informed decisions regarding capital allocation and M&A strategy. The Deal Tracker is a proprietary information service that monitors capital raise and M&A activity in the legal cannabis, CBD, and psychedelics industries. Each week the Tracker aggregates and analyzes all closed deals and segments each according to key metrics:
-
Deals by Industry Sector (To track the flow of capital and M&A Deals by one of 12 Sectors - from Cultivation to Brands to Software)
-
Deal Structure (Equity/Debt for Capital Raises, Cash/Stock/Earnout for M&A) Status of the company announcing the transaction (Public vs. Private)
-
Principals to the Transaction (Issuer/Investor/Lender/Acquirer) Key deal terms (Pricing and Valuation)
-
Key Deal Terms (Deal Size, Valuation, Pricing, Warrants, Cost of Capital)
-
Deals by Location of Issuer/Buyer/Seller (To Track the Flow of Capital and M&A Deals by State and Country)
-
Credit Ratings (Leverage and Liquidity Ratios)
Since its inception in 2015, the Viridian Cannabis Deal Tracker has tracked and analyzed more than 2,500 capital raises and 1,000 M&A transactions totaling over $50 billion in aggregate value.
The preceding article is from one of our external contributors. It does not represent the opinion of Benzinga and has not been edited.
Edge Rankings
Price Trend
© 2025 Benzinga.com. Benzinga does not provide investment advice. All rights reserved.
Trade confidently with insights and alerts from analyst ratings, free reports and breaking news that affects the stocks you care about.
Cannabis is evolving—don’t get left behind!
Curious about what’s next for the industry and how to stay ahead in today’s competitive market?
Join top executives, investors, and industry leaders at the Benzinga Cannabis Capital Conference in Chicago on June 9-10. Dive deep into market-shaping strategies, investment trends, and brand-building insights that will define the future of cannabis.
Secure your spot now before prices go up—this is where the biggest deals and connections happen!