In our January 2024 outlook, we asserted that cannabis equity analysts, having been burned by the need for continual downward revisions in 2023, were undershooting in their 2024 & 2025 estimates. First quarter results are now in for ten major MSOs, and the results lend credence to our claims.

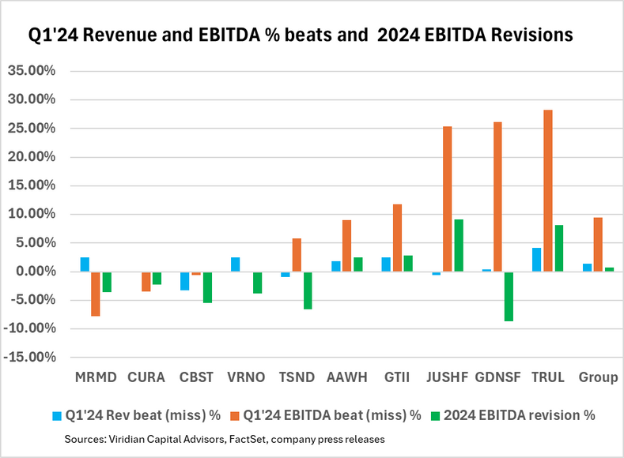
The chart depicts the percentage beat (miss) for revenues and EBITDA for Q1’24 and the subsequent percentage revision to consensus 2024 EBITDA estimates. The chart is organized in order of increasing percentage Q1 EBITDA beats.
The blue line on the chart shows the percentage revenue beat (miss). Four of the companies missed their estimates by amounts that ranged from -.09% for Curaleaf to -3.24% for Cannabist. The group, in the aggregate, beat estimates by about 1.4%.
EBITDA beats, shown by the orange line, were more significant. Three companies missed estimates, with the biggest miss from MariMed MRMD (off by 10%). The beats were generally more substantial, with TerrAscend TRSSF, Ascend, and Green Thumb turning in results that were over 5% better than estimates. Jushi, Goodness Growth, and Trulieve all beat EBITDA estimates by more than 25%. The group, in the aggregate, beat EBITDA estimates by $37M (9.47%).
The most significant driver of increased EBITDA was higher margins. Eight of the ten companies beat EBITDA margin estimates.
Although the group EBITDA beat estimates by $37M, full-year EBITDA estimates have only been increased by $14M. Consensus 2024 estimates have actually been cut for six of the ten companies over the last month! Furthermore, full-year margins for the group are now projected to be 25.96%, lower than the 26.65% actual for the first quarter. The first quarter is seasonally the weakest quarter and first quarter margins have been lower that full-year margins for the last two years.
Analysts are again playing catch up, but thankfully, this time in the upward direction.
The Viridian Capital Chart of the Week highlights key investment, valuation and M&A trends taken from the Viridian Cannabis Deal Tracker.
The Viridian Cannabis Deal Tracker provides the market intelligence that cannabis companies, investors, and acquirers utilize to make informed decisions regarding capital allocation and M&A strategy. The Deal Tracker is a proprietary information service that monitors capital raise and M&A activity in the legal cannabis, CBD, and psychedelics industries. Each week the Tracker aggregates and analyzes all closed deals and segments each according to key metrics:
-
Deals by Industry Sector (To track the flow of capital and M&A Deals by one of 12 Sectors - from Cultivation to Brands to Software)
-
Deal Structure (Equity/Debt for Capital Raises, Cash/Stock/Earnout for M&A) Status of the company announcing the transaction (Public vs. Private)
-
Principals to the Transaction (Issuer/Investor/Lender/Acquirer) Key deal terms (Pricing and Valuation)
-
Key Deal Terms (Deal Size, Valuation, Pricing, Warrants, Cost of Capital)
-
Deals by Location of Issuer/Buyer/Seller (To Track the Flow of Capital and M&A Deals by State and Country)
-
Credit Ratings (Leverage and Liquidity Ratios)
Since its inception in 2015, the Viridian Cannabis Deal Tracker has tracked and analyzed more than 2,500 capital raises and 1,000 M&A transactions totaling over $50 billion in aggregate value.
The preceding article is from one of our external contributors. It does not represent the opinion of Benzinga and has not been edited.
© 2025 Benzinga.com. Benzinga does not provide investment advice. All rights reserved.
Trade confidently with insights and alerts from analyst ratings, free reports and breaking news that affects the stocks you care about.
Cannabis is evolving—don’t get left behind!
Curious about what’s next for the industry and how to stay ahead in today’s competitive market?
Join top executives, investors, and industry leaders at the Benzinga Cannabis Capital Conference in Chicago on June 9-10. Dive deep into market-shaping strategies, investment trends, and brand-building insights that will define the future of cannabis.
Secure your spot now before prices go up—this is where the biggest deals and connections happen!