

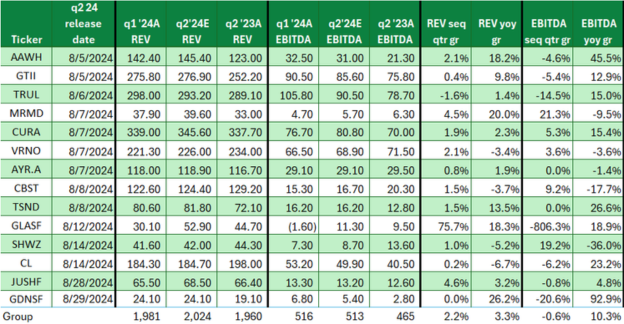
The graph shows the calculated percentage growth rates of EBITDA, arranged in increasing order of sequential quarterly growth rates (orange bars.) The blue bars show year-over-year growth rates, and the green bars show estimated full-year 2024 EBITDA vs actual 2023 EBITDA.
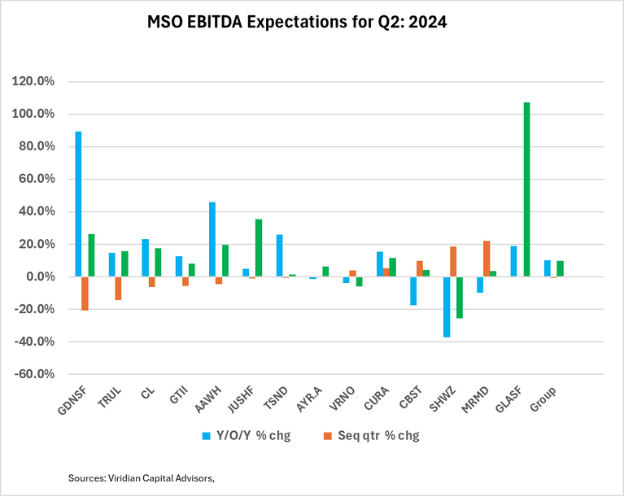
Half of the companies on the chart have projected negative sequential growth in EBITDA for Q2: 24. This is surprising because Q2 is generally a seasonally stronger quarter, and in the previous three years, an average of nearly 80% of the companies on the chart have had higher EBITDA in Q2 compared to Q1.
Analysts are projecting a 10.2% y/o/y EBITDA growth for Q2 and full-year 2024 EBITDA growth of 9.8% compared to 2023. However, 1st half of 2024 results, including the Q2 estimates, are 14.2% higher than the 1st half of 2023, implying that second-half growth will only be around 6.0%. Are analysts expecting dramatic slowing, or have they just not updated their 2024 estimates?
Anecdotally, IR spokesmen for several companies have spoken of tightening consumer spending, price declines in New Jersey and other markets, and a generally competitive retail environment.
While we don’t challenge the idea of a consumer slowdown, we continue to believe sell-side analysts are being slow to adjust earnings estimates upward, and the impact of Ohio in the second half seems underappreciated.
The Viridian Capital Chart of the Week highlights key investment, valuation and M&A trends taken from the Viridian Cannabis Deal Tracker.
The Viridian Cannabis Deal Tracker provides the market intelligence that cannabis companies, investors, and acquirers utilize to make informed decisions regarding capital allocation and M&A strategy. The Deal Tracker is a proprietary information service that monitors capital raise and M&A activity in the legal cannabis, CBD, and psychedelics industries. Each week the Tracker aggregates and analyzes all closed deals and segments each according to key metrics:
-
Deals by Industry Sector (To track the flow of capital and M&A Deals by one of 12 Sectors - from Cultivation to Brands to Software)
-
Deal Structure (Equity/Debt for Capital Raises, Cash/Stock/Earnout for M&A) Status of the company announcing the transaction (Public vs. Private)
-
Principals to the Transaction (Issuer/Investor/Lender/Acquirer) Key deal terms (Pricing and Valuation)
-
Key Deal Terms (Deal Size, Valuation, Pricing, Warrants, Cost of Capital)
-
Deals by Location of Issuer/Buyer/Seller (To Track the Flow of Capital and M&A Deals by State and Country)
-
Credit Ratings (Leverage and Liquidity Ratios)
Since its inception in 2015, the Viridian Cannabis Deal Tracker has tracked and analyzed more than 2,500 capital raises and 1,000 M&A transactions totaling over $50 billion in aggregate value.
The preceding article is from one of our external contributors. It does not represent the opinion of Benzinga and has not been edited.
© 2025 Benzinga.com. Benzinga does not provide investment advice. All rights reserved.
Trade confidently with insights and alerts from analyst ratings, free reports and breaking news that affects the stocks you care about.


Cannabis is evolving—don’t get left behind!
Curious about what’s next for the industry and how to stay ahead in today’s competitive market?
Join top executives, investors, and industry leaders at the Benzinga Cannabis Capital Conference in Chicago on June 9-10. Dive deep into market-shaping strategies, investment trends, and brand-building insights that will define the future of cannabis.
Secure your spot now before prices go up—this is where the biggest deals and connections happen!