What’s the right way to measure Cannabis company leverage?
The standard answer is Debt/EBITDA; however, Viridian believes the single best valuation measure is Total Liabilities / Market Cap, which reflects the market’s estimation of the asset value above liabilities. It is immune to accounting manipulations and reacts instantly to news that changes investors’ views of company value.

Some investors, however, are more comfortable with an accounting-based measure, and Viridian also makes use of these ratios in the Viridian Capital Credit Tracker model. We are in the process of incorporating a new measure into the model utilizing several core principles:
Leases make up a large portion of the capital of many cannabis companies and should be treated as debt. Lease liabilities make up 82% of combined debt and leases at Planet 13 PLNH, 63% at 4Front FFNTF, 47% at Green Thumb GTII and Ascend AAWH, and 46% at Curaleaf CURLF. They represent long-term fixed obligations, often on “mission critical” facilities, and they frequently contain cross-default clauses to other obligations. Defaulting on a lease cannot technically trigger bankruptcy, but there are no bankruptcy protections afforded cannabis companies anyway.
Cannabis companies have recently been failing to pay their taxes and are basically borrowing money from the government, often at rates that are better than they could get in the market. Viridian considers accrued tax liabilities in excess of one-quarter of tax expense as debt, irrespective of whether the company classifies these liabilities as current or long-term.
Viridian calculates adjusted net debt by adding leases and excess taxes to total debt before subtracting cash.
But, since operating lease payments reduce EBITDA, it is not fair to include leases as debt without also adjusting EBITDA. Viridian adds lease expenses to EBITDA to calculate EBITDAR. Since analysts generally do not project forward lease expenses, we annualized the most recent quarterly rent in our estimates.
Shouldn’t the standard EV/EBITDA valuation metric be similarly adjusted?
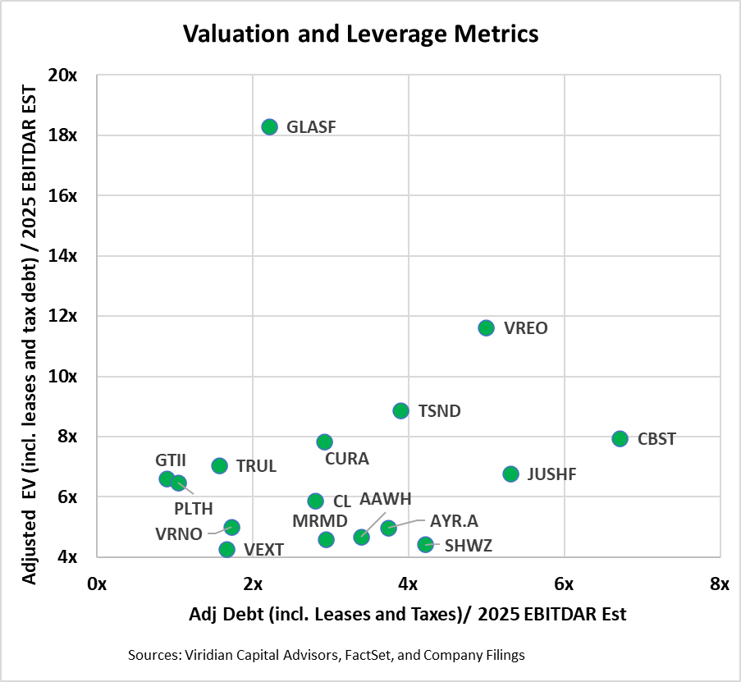
Yes, although Viridian calculates these standard ratios as part of our valuation work, we believe a more sophisticated metric is also warranted. We calculate Enterprise value by adding our adjusted net debt measure to market cap. We then use EBITDA as the denominator in the EV/EBTIDAR ratio.
The graph shows baseline values for the new leverage and valuation metrics. The inclusion of leases and taxes generally produces higher leverage and valuation metrics. This week’s tracker will investigate some of the relative impacts on both leverage and valuation of these metrics, which we believe are more representative of financial reality.
The Viridian Capital Chart of the Week highlights key investment, valuation and M&A trends taken from the Viridian Cannabis Deal Tracker.
The Viridian Cannabis Deal Tracker provides the market intelligence that cannabis companies, investors, and acquirers utilize to make informed decisions regarding capital allocation and M&A strategy. The Deal Tracker is a proprietary information service that monitors capital raise and M&A activity in the legal cannabis, CBD, and psychedelics industries. Each week the Tracker aggregates and analyzes all closed deals and segments each according to key metrics:
-
Deals by Industry Sector (To track the flow of capital and M&A Deals by one of 12 Sectors - from Cultivation to Brands to Software)
-
Deal Structure (Equity/Debt for Capital Raises, Cash/Stock/Earnout for M&A) Status of the company announcing the transaction (Public vs. Private)
-
Principals to the Transaction (Issuer/Investor/Lender/Acquirer) Key deal terms (Pricing and Valuation)
-
Key Deal Terms (Deal Size, Valuation, Pricing, Warrants, Cost of Capital)
-
Deals by Location of Issuer/Buyer/Seller (To Track the Flow of Capital and M&A Deals by State and Country)
-
Credit Ratings (Leverage and Liquidity Ratios)
Since its inception in 2015, the Viridian Cannabis Deal Tracker has tracked and analyzed more than 2,500 capital raises and 1,000 M&A transactions totaling over $50 billion in aggregate value.
The preceding article is from one of our external contributors. It does not represent the opinion of Benzinga and has not been edited.
© 2025 Benzinga.com. Benzinga does not provide investment advice. All rights reserved.
Trade confidently with insights and alerts from analyst ratings, free reports and breaking news that affects the stocks you care about.
Cannabis is evolving—don’t get left behind!
Curious about what’s next for the industry and how to stay ahead in today’s competitive market?
Join top executives, investors, and industry leaders at the Benzinga Cannabis Capital Conference in Chicago on June 9-10. Dive deep into market-shaping strategies, investment trends, and brand-building insights that will define the future of cannabis.
Secure your spot now before prices go up—this is where the biggest deals and connections happen!