AT A GLANCE
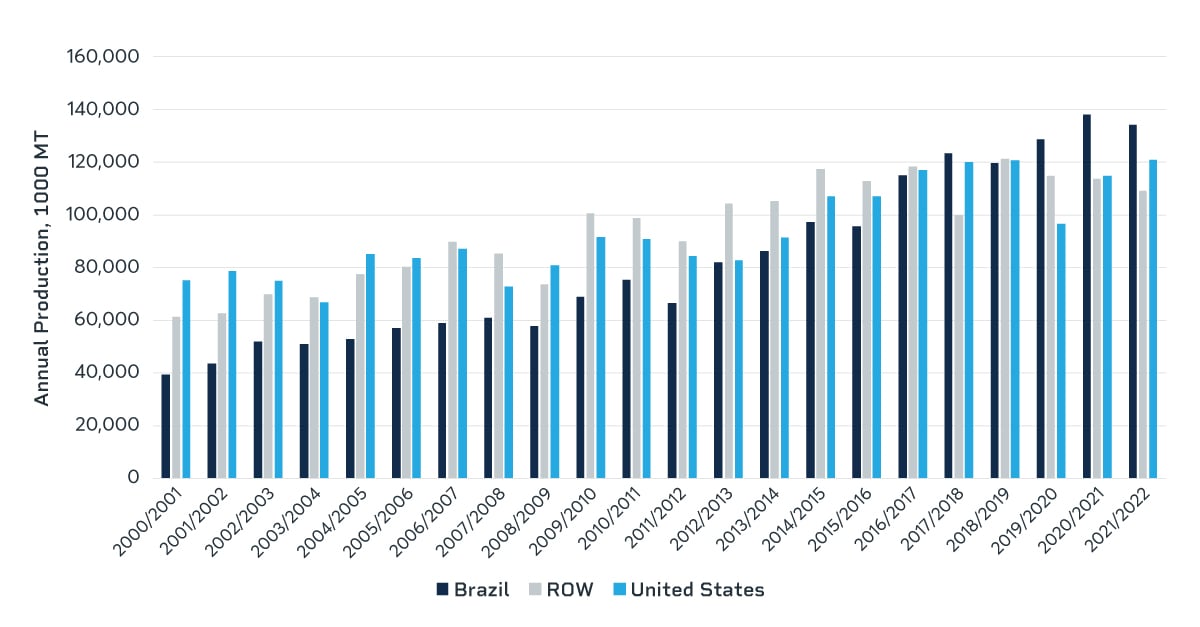
- Brazil is the leading producer of soybeans globally, passing U.S. production by 13.3 million metric tons in the 2021/2022 crop year
- Market participants can now trade a defined spread to help manage risk between soybean crops in the northern and southern hemispheres
Brazil can no longer be considered an ascendant power in the global soybean market; Brazil is dominant. Brazil overtook U.S. soybean production in the 2017/2018 crop year, and in 2021/2022, surpassed U.S. production by 13.3 million metric tons. Although North American and South American soybean markets remain distinct, supply and demand drivers are interconnected.

Scan the above QR code for more expert analysis of market events and trends driving opportunities today!
ANNUAL SOYBEAN PRODUCTION

A Global Commodity
Although Brazil overtook the United States as the world’s foremost soybean producer only in the last five years, Brazil exceeded the United States in exports one half-decade before. Brazil has exported, on average, 53% of its production in the 21st century; and in the 2021/2022 crop year, the country exported 68% of its production. Brazilian exports as a percentage of domestic production generally exceed the U.S. share of production exported, as well as the average export share among soybean producing nations globally.
ANNUAL SOYBEAN EXPORTS AND PERCENT OF PRODUCTION EXPORTED

Such a large and export-heavy market put Brazil in a place of global importance as a soybean producer. Brazil’s markets and Brazilian domestic pricing have a global impact. Although globalization has brought local prices for functionally interchangeable commodities (for example, North American and South American soybeans) in correlation over the past decades, Brazilian and other South American soybeans experience factors unique to their point of origin that cause price deviations from the North American crop. The Brazilian soybean growing season, for example, yields a new crop in March through May, while November futures represent the new crop year for CBOT Soybean futures (ZS). Additionally, a long growing season in Brazil’s temperate climate allows for two harvests (termed “double cropping,” which generally means soybeans, then corn) per calendar year; it’s a feat not widely possible in the United States.
Different Risk Profiles
CME Group launched FOB Santos Soybeans Financially Settled (Platts) futures, referred to as “SAS” for South American Soybeans, contract on Sept. 21, 2020. SAS is a regional price discovery and price risk management tool that is often traded in conjunction with the benchmark ZS futures contract. To manage risk between the price differences of the SAS and ZS futures contracts, market participants can now trade a defined spread on the CME Globex electronic trading platform. Trading a defined spread gives a participant with exposure to both North American and South American markets a simplified pathway to offset risk with lower margins than trading outright contracts.
FRONT-MONTH SAS, ZS, AND SAS-ZS SPREAD

The volatile spread between SAS and ZS is indicative of the differing fundamentals underpinning the two markets. The spread between the two products is generally positive, with SAS exceeding ZS in price, reaching an annual high in early October 2021 after the Sept. 30, 2021, USDA Grain Stocks report espoused robust metrics on the domestic crop at a time of an already strong spread. Conversely, July and early August 2022 saw a negative spread due to strong U.S. soybean meal and oil demand, in addition to adverse weather in the United States. A lower-than-expected early 2022 Brazilian soybean crop was a tailwind for both South and North American U.S. prices early and mid-year.
Demonstrative of the different risk profiles of each product is the differing basis behind the two markets. Basis represents the difference between spot cash prices and the nearby futures; basis volatility and basis risk are important factors to market participants hedging physical supply. Low cash prices relative to futures yields what is referred to as a weak basis, which is generally indicative of adequate or abundant physical supply. A strong basis – a high cash price relative to futures – can indicate tight physical supply in the cash market. Lower basis volatility points to a stable relationship between cash and futures, allowing for a lower-risk physical hedge using derivative products. The SAS-ZS spread can serve as a hedge for basis volatility.
Soybean markets are global markets. A drought in Bahia, Brazil, affects an Iowa farmer’s profits. A railway strike in Illinois would put pressure on shippers in the Brazilian Port of Santos. Low water levels in the Parana river threaten the ability for soybeans grown throughout the South American continent to reach foreign importers, haunting soybean markets from Chicago to Dalian. With the launch of FOB Santos Soybeans Financially Settled (Platts) futures in 2020, CME Group has created a unified venue in which to hedge both North American and South American soybean exposure.
© 2024 Benzinga.com. Benzinga does not provide investment advice. All rights reserved.
Comments
Trade confidently with insights and alerts from analyst ratings, free reports and breaking news that affects the stocks you care about.