

AT-A-GLANCE
- Wheat futures are in contango whereas corn & soy futures are flat or in backwardation
- Implied volatility (CVOL) for wheat is 2x as high as CVOL for corn or soybeans
- Upside skewness is also much greater in wheat options than in corn or soy
- The Black Sea remains the preeminent exporters of wheat but not corn or soy
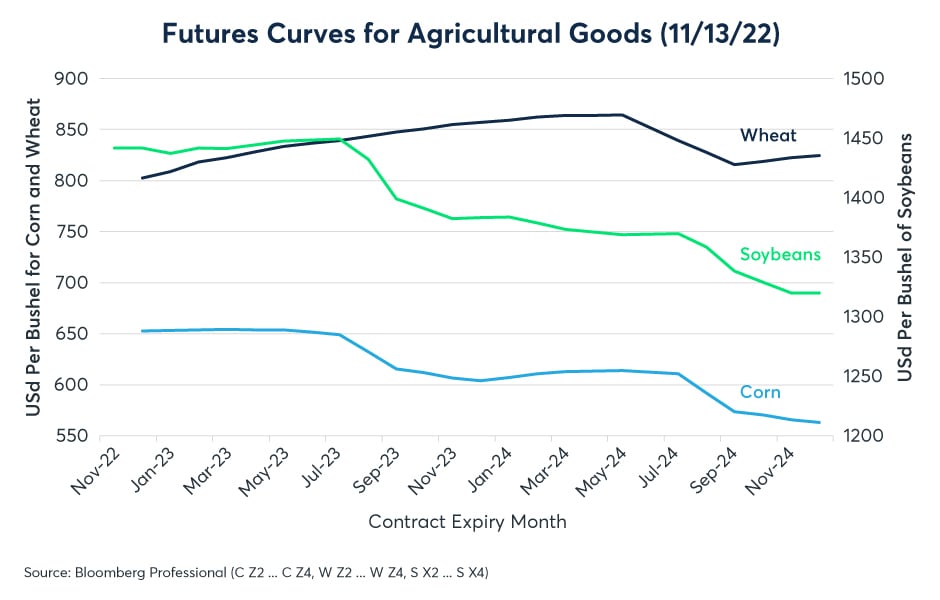
After nearly nine months of conflict between Russia and Ukraine, traders in futures and options markets continue to take a strikingly different view of corn and soybeans, on the one hand, and wheat on the other. The futures curves for corn and soybeans are flat over the next year, suggesting that traders are focusing their expectations near current spot prices. From September 2023 onwards, the corn and soybean curves are in backwardation, suggesting that traders anticipate an eventual price decline towards levels that prevailed for much of the period from 2015 to 2021. By contrast, futures markets in wheat remain in contango, which suggests that traders see a risk of prices rising well into 2024 (Figure 1).
Figure 1: Wheat is in contango while corn & soy are flat near term, then in backwardation
Options markets for wheat remain in a very different state than options markets for corn and soybeans as well. CVOL, CME’s new, comprehensive view of volatility across call and put options of various strike prices, show wheat options implied volatility trading near 40%. That’s nearly twice the level for corn and soybeans. Prior to Russia’s invasion, wheat options traded broadly in line with the implied volatility in the other two markets (Figure 2).
Figure 2: Wheat options are roughly 2x as expensive as corn or soybean options

Not only are wheat options roughly twice as expensive from an implied volatility perspective as corn and soybean options, but they also have a much different skew. Currently, out-of-the-money call options on soybeans cost roughly the same as out-of-the-money puts. For corn, out-of-the-money call options are just slightly more expensive than out-of-the-money puts. By contrast, wheat’s out-of-the-money calls are dramatically more expensive than out-of-the-money puts (Figure 3). Overall, options prices suggest that not only do traders see much higher risks in the wheat market than in corn or soybeans, but they also see those risks skewing sharply to the upside.
Figure 3: Wheat options skew sharply to the upside with exceptionally expensive calls
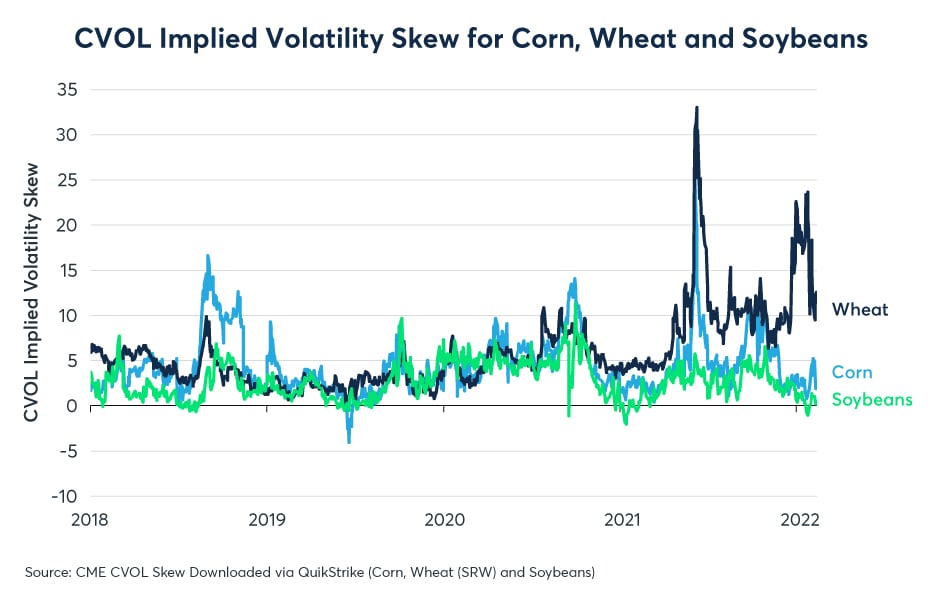
Both wheat’s overall CVOL and the CVOL skew have diminished somewhat after Russia backed down from threats to pull out of the grain shipment deal that it had reached with Ukraine and Turkey over the summer. Even so, both the level CVOL and skew remain very different than in the other markets.
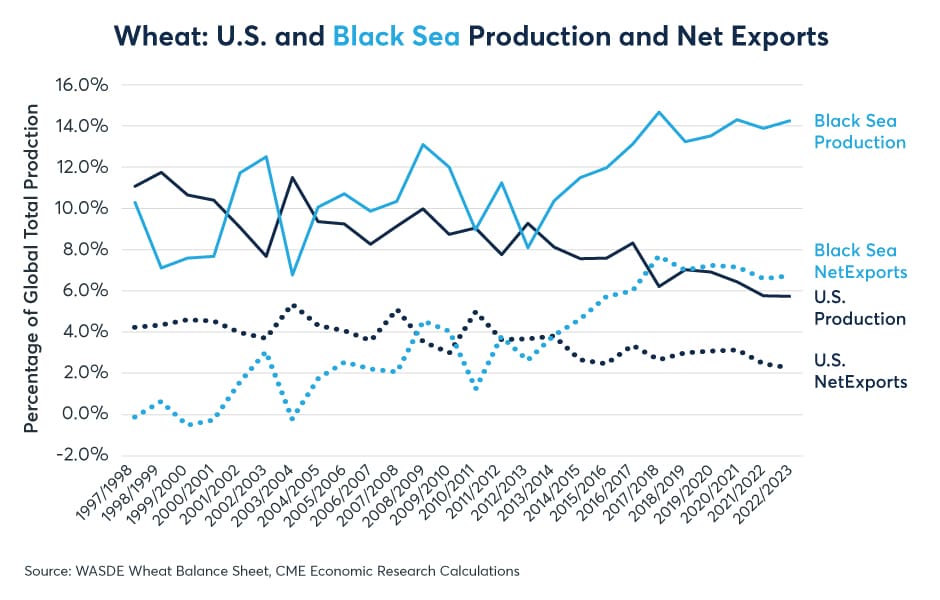
Traders’ concerns stem from the dominant position that Russia and Ukraine hold in the export of wheat globally, with the Black Sea region accounting for 14% of global production, about half of which is exported. Production from the U.S., the next biggest global supplier, is only about half as large (Figure 4). Thus, any actual or threatened supply disruption from the area has disproportionately large potential consequences for wheat.
Figure 4: The Black Sea region remains the world’s dominant producer/exporter of wheat
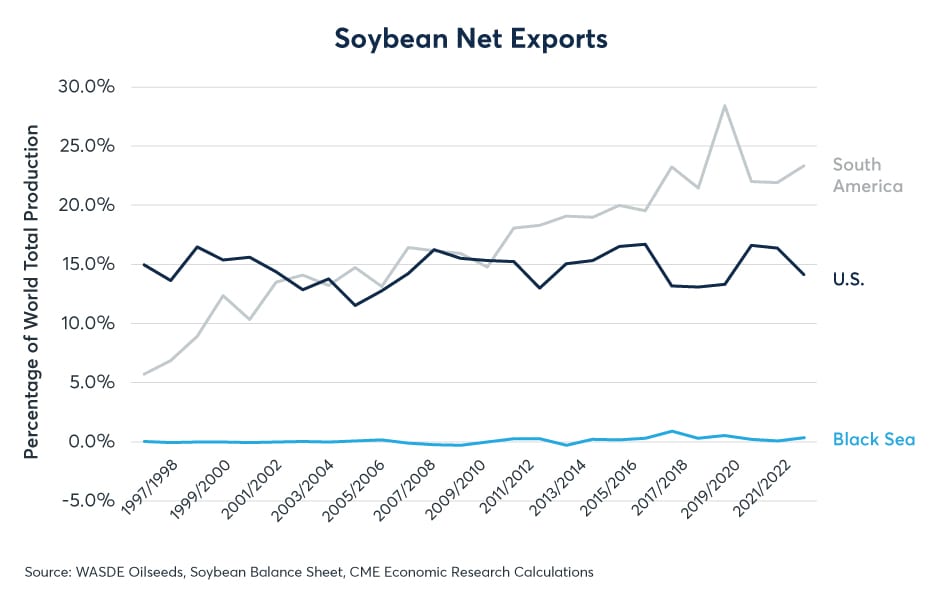
The Black Sea region is also an important exporter of corn, but its exports are only about half as large as those of the U.S. and one-third as large as those of South American nations like Argentina and Brazil (Figure 5). The contrast is even greater with soybeans, where the Black Sea region never developed into a major exporter, and exports from the U.S. remain extremely robust (Figure 6).
Figure 5: Black Sea corn exports may fall but South America could fill the gap
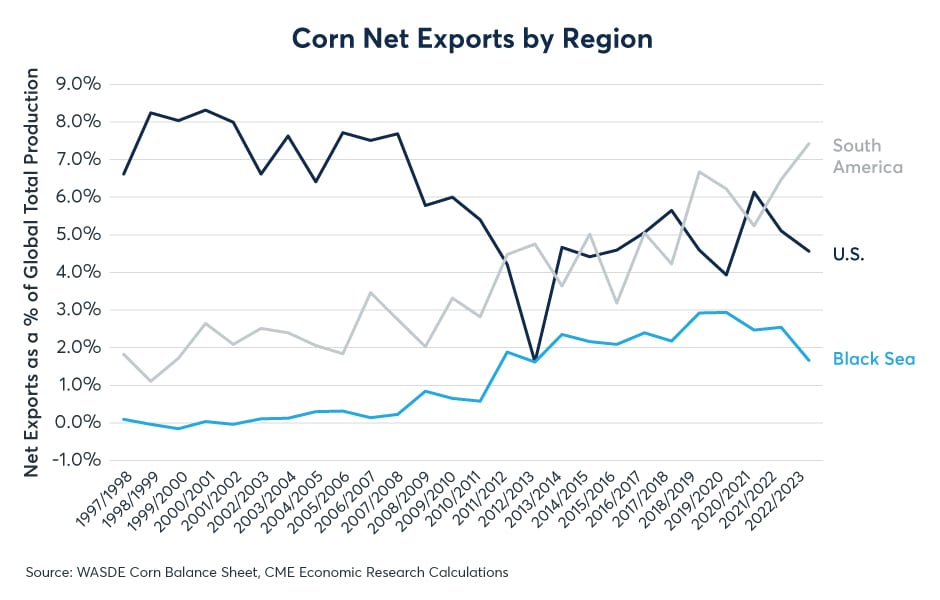
Figure 6: The Black Sea region never developed into a major producer of soybeans
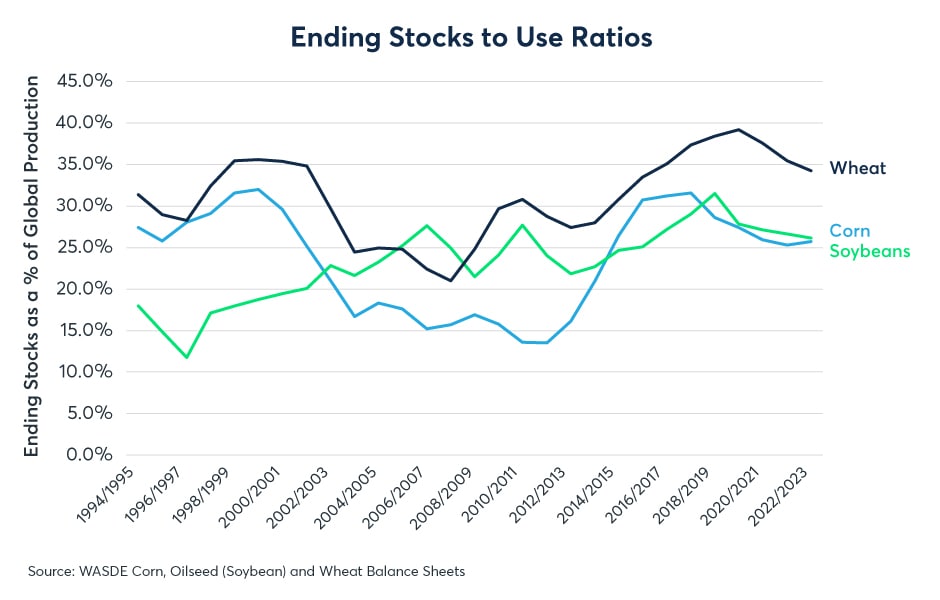
Globally, inventories of wheat have declined somewhat but remain at higher levels than in most years, with the exception of the period from 2018 to 2021. Ending-stocks-to-use ratios also remain elevated for soybeans and corn, though both of these commodities have seen their inventories decline slightly from peak levels from 2016 to 2019 (Figure 7).
Figure 7: Global ending stocks of wheat, corn and soybeans remain elevated
The still robust level of wheat inventories could create substantial downside risks should the conflict between Russia and Ukraine come to quick resolution. While there has been some discussion that the two sides might sit down and negotiate this winter, the two sides remain far apart in their publicly stated demands, and there does not appear to be any movement towards a settlement just yet.
This post contains sponsored advertising content. This content is for informational purposes only and not intended to be investing advice.
© 2025 Benzinga.com. Benzinga does not provide investment advice. All rights reserved.
Trade confidently with insights and alerts from analyst ratings, free reports and breaking news that affects the stocks you care about.

