- BTC/USD attracts new money and is close to a new upside segment.
- ETH/USD follows Bitcoin up but shows a lack of strength.
- XRP/USD takes it easy and awaits events.
It dawns in Europe with key Crypto players on the verge of breaking key resistance levels. A consistent closure above these caps would open the door to a new bullish segment of the sector.
The strong rise made by the BCH/USD in the last few hours is significant news for other cryptos as well. Bitcoin Cash is also tackling key resistance levels.
Bitcoin and the Ethereum technically stand out as both showed more degraded indicators are behaving better than Ripple. In turn, the XRP presented a perfect configuration to take advantage of any bullish impulse.
The key resistance levels to watch are $6.764 in BTC/USD, $247.75 in ETH/USD, and the relative maximum in $0.60 for the XRP/USD.
BTC/USD 240-Min.
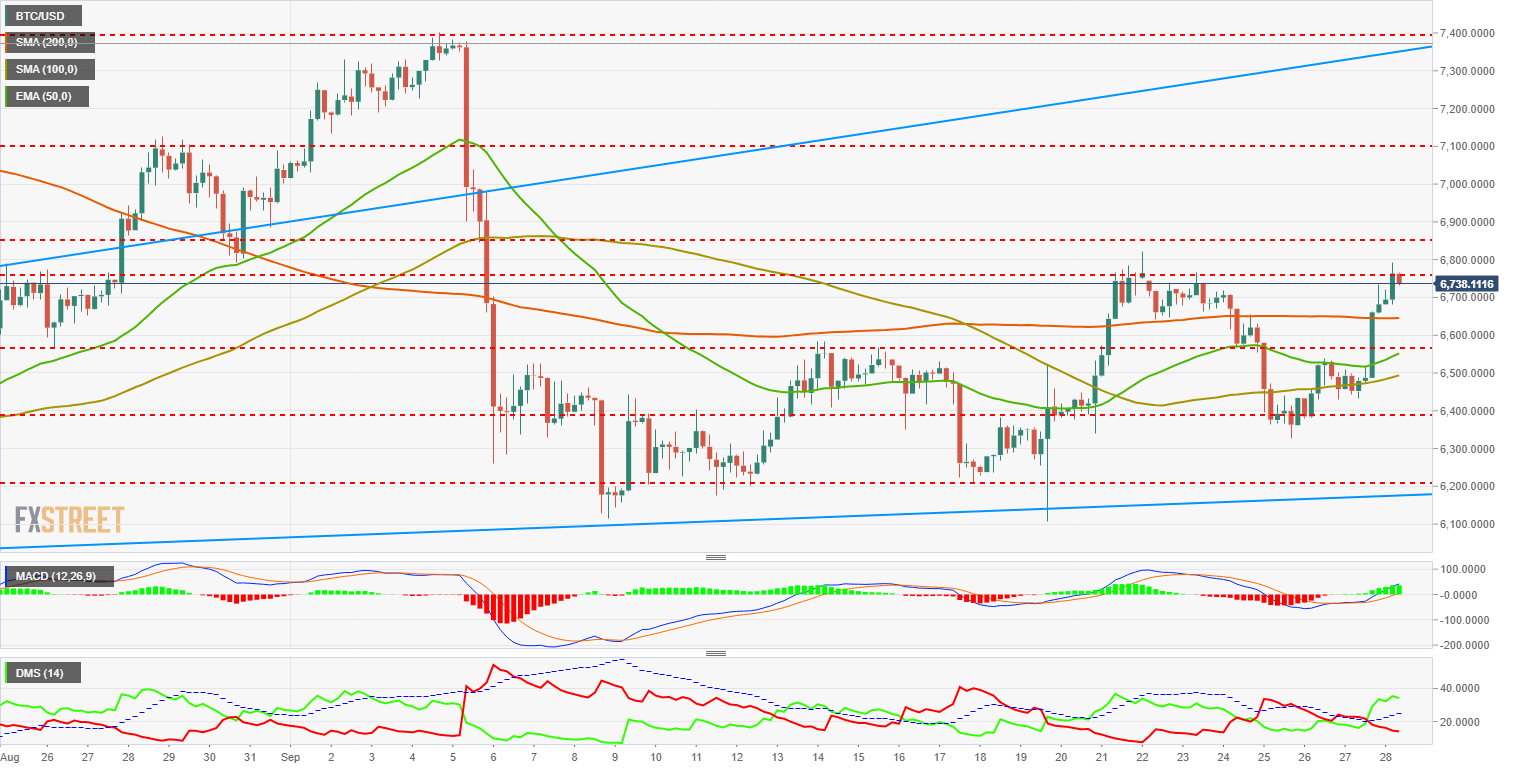
The BTC/USD is currently trading at the price level of $6.766. A close at this level would give us a signal, as it exceeds the short term relative maximum close although by a small margin the signal loses strength.
Above the current price, the first resistance level is at $6,850 (price congestion resistance), the second one at $7,100 (price congestion resistance) and finally, we eye the very important resistance level at $7,384 (medium-term relative maximum). To reach this level, it will be necessary for the BTC/USD to recover the trend line from the annual lows, which is one more obstacle to add.
Below the current price, the first support is on the SMA200 at the price level of $6.645. Below this support level, the next support is at $6.566 (price congestion support), then at $6.552 (EMA50) and as a third support we look at $6.493 (SMA100).

The MACD at 240-Min reflects a rise above the zero level and is on the bullish side of the indicator. It acquires a good bullish inclination and the distance between lines provides potential in the short term.
The DMI at 240-Min confirms the movement and the bulls take absolute control of the situation. The bears withdraw quickly and go clearly below level 20. This configuration also gives room for bullish continuity.
ETH/USD 240-Min
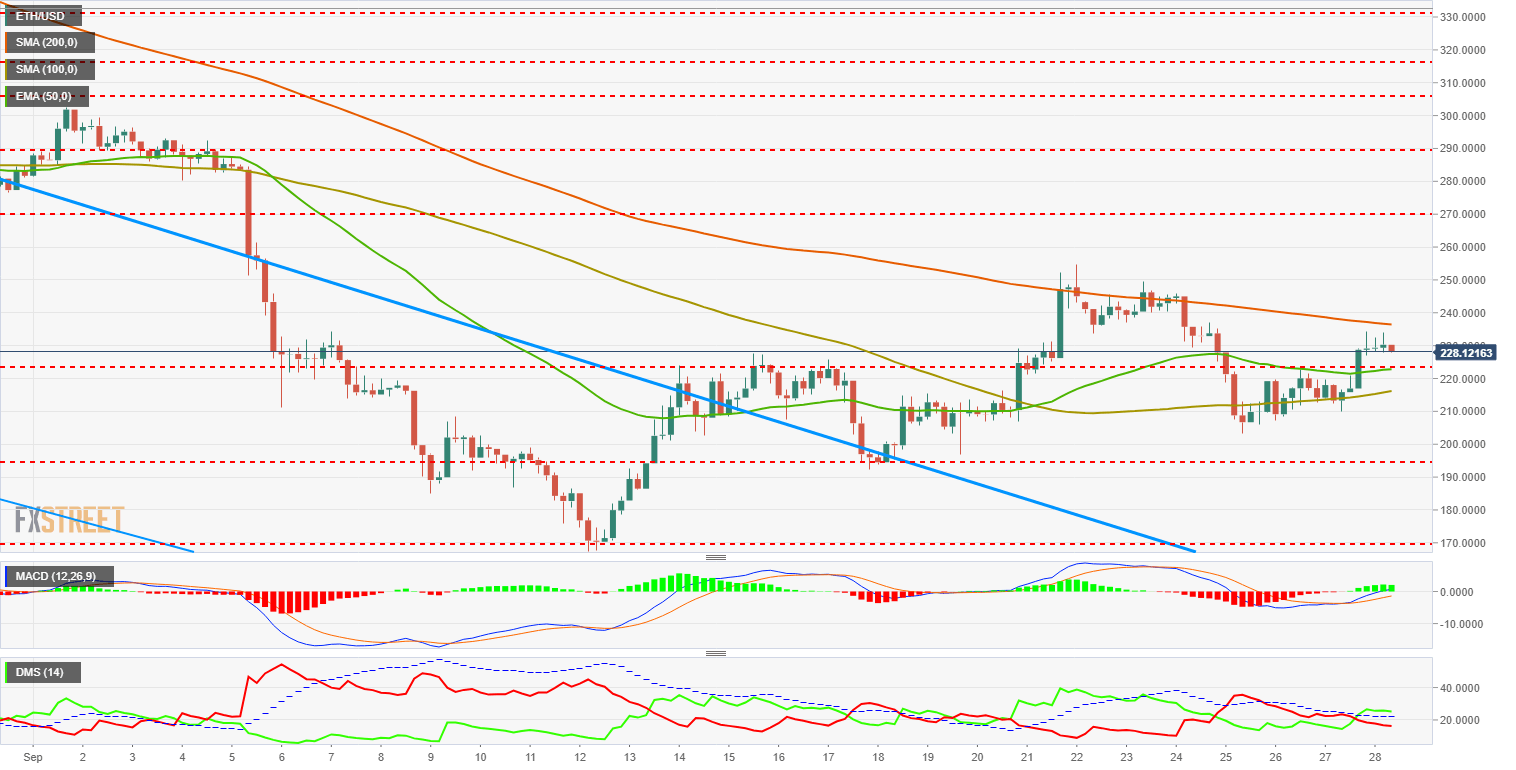
The ETH/USD is currently quoted on the $228 price level. It moves between moving averages and its main challenge apart from the relative maximum is to outperform the SMA200 and gain upside free space.
Above the current price, the resistance is at $236 (SMA200). If this level is exceeded, the ETH/USD will have some clean space until the next resistance level at $270 (price congestion resistance). The third resistance level is found at $290 (price congestion resistance) and already at the gates of the important $300 level.
Below the current price, the first support is $220 price level (EMA50 and price congestion support). The second support is at $216 (SMA100) and as a cut-off point within the current support scenario, we see $195 (price congestion support).

The MACD at 240-Min shows a good bullish reaction, but in the case of the ETH/USD, it does not manage to get above the zero line. This means that Ether will find it hard to take advantage of the money that enters the Crypto sector.
The DMI to 240-Min shows us that bulls are taking control but not in a very forceful way. Its horizontal profile lets us see that there is not much conviction in the climbs. Luckily for the bulls, the bears do not have a clear sight either and continue decreasing in intensity.
XRP/USD 240-Min
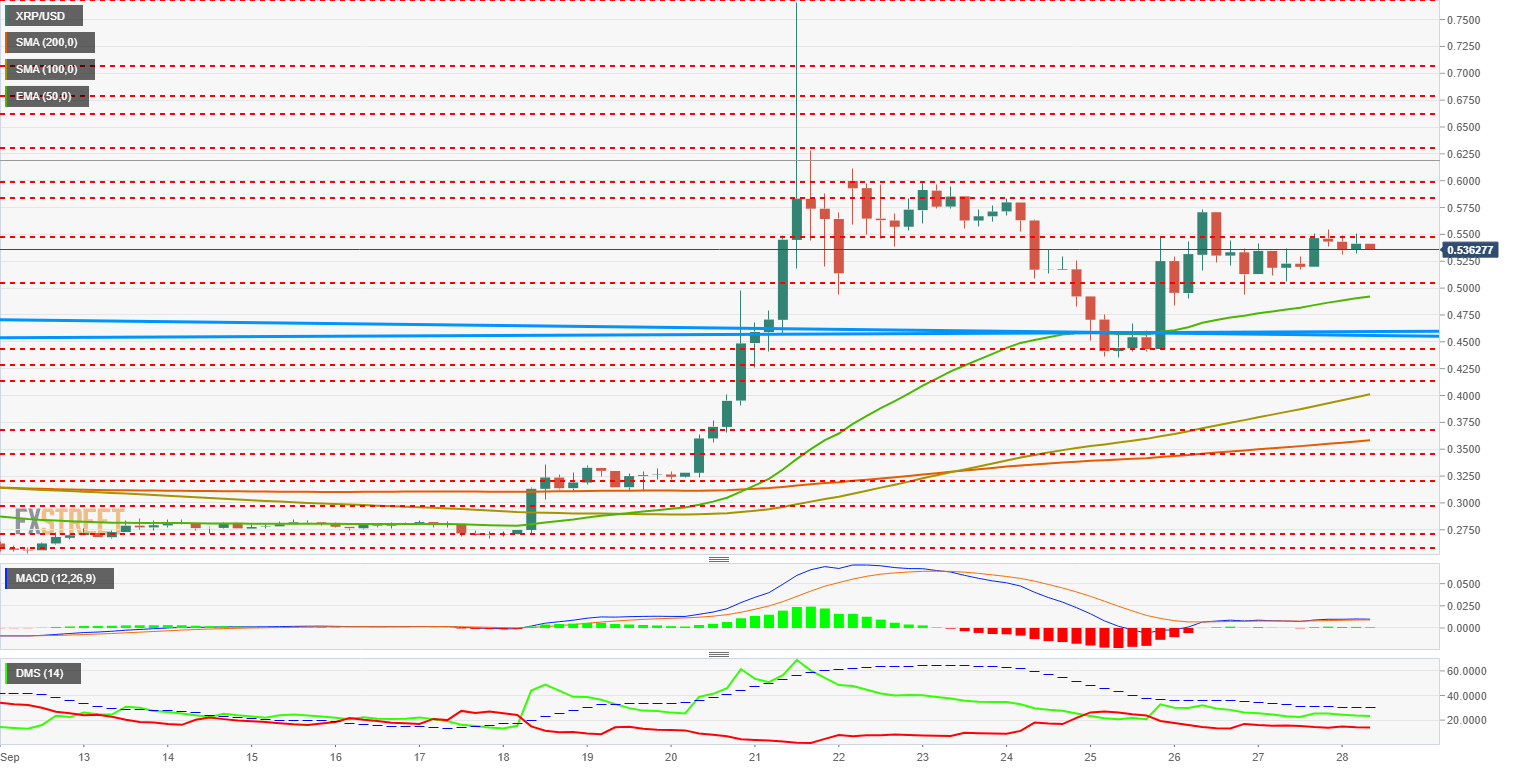
The XRP/USD is currently trading at the $0.537 price level. Of the three main Cryptos in the market, today it is the Ripple's turn to be the laggard. However, Ripple remains ahead thanks to last week's strong gains but for now, it loses the opportunity to continue improving.
Above current price, the first resistance is at $0.55 (price congestion resistance). So, a second resistance line is at $0.583 (price congestion resistance) and the third resistance level at $0.60, a key support level that did not manage to close above on the 4H chart in the recent rise.
Below the current price, the first support is at $0.505 price level (price congestion support), the second support is at $0.492 (EMA50) and as a key level the XRP/USD should not lose, the third support is at $0.46 (medium and long-term trend line support).

The MACD at 240-Min has not changed its profile since yesterday. The lack of price reaction leaves a very horizontal indicator and gives us very little information beyond highlighting that it moves on the bullish side of the indicator.
The DMI at 240-Min continues to show bulls are in control of the situation and it still remains above the 20 level. The downside is that bullish traders are not convinced on their side of the market. On the other hand, bears remain at a low but sustained level.
© 2025 Benzinga.com. Benzinga does not provide investment advice. All rights reserved.
Trade confidently with insights and alerts from analyst ratings, free reports and breaking news that affects the stocks you care about.