On May 4, Dogecoin DOGE/USD jumped over a fence of resistance and ran up to a new all-time high of $0.69 the following day, a milestone Dogecoin enthusiasts had hoped to reach on April 20.
Dogecoin traders are hoping for another big bullish move in the cryptocurrency leading up to May 8 when Tesla TSLA CEO Elon Musk will host "Saturday Night Live."
Fans of the crypto will be watching closely to see If Musk’s performance prompts more hype or if it marks the top for the Shibu Inu-branded coin.
With Dogecoin trading near all-time highs, there is little price history on the daily chart but, over the past 24 hours, the coin has created support and resistance levels on the four-hour chart.
See Also: How to Buy Dogecoin
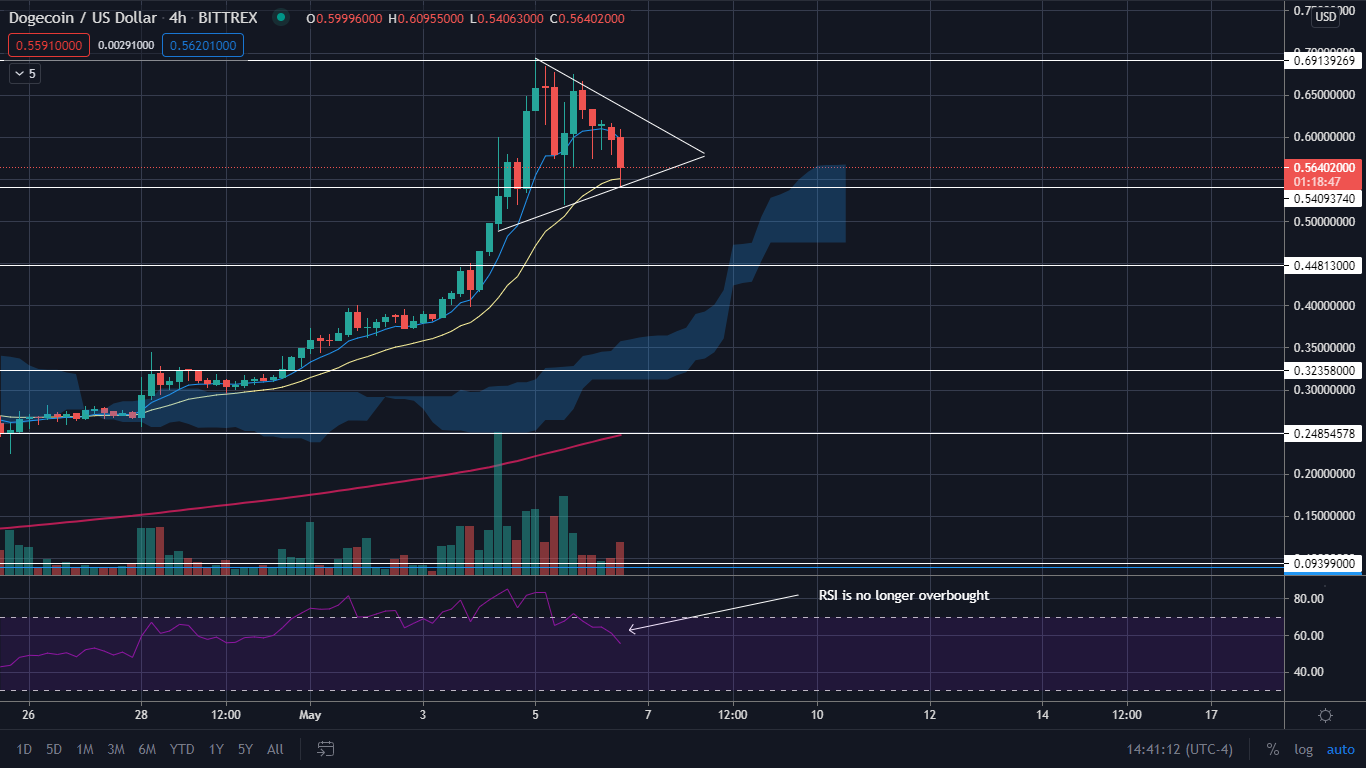
The 4-hour Dogecoin Chart: Since making a new all-time high, Dogecoin has settled into consolidation in the form of a symmetrical triangle which has helped to cool its relative strength index (RSI).
RSI is a momentum indicator that measures the magnitude of price changes. An RSI of over 70% is considered overbought and an RSI of under 30% is considered oversold. On Thursday, Dogecoin’s RSI measured in at 55% compared to May 4 when Dogecoin’s RSI hit 85%.
Dogecoin is being supported by both the lower upward sloping trendline of the symmetrical triangle and a newly developed support level of about $0.54 on the four-hour time frame. Dogecoin will reach the apex of the symmetrical triangle at exactly midnight on Saturday, right in the middle of "SNL," and should choose either a bullish or bearish direction before then.

Dogecoin is trading below the eight-day exponential moving average (EMA) but above the 21-day EMA, which indicates bullish indecision. The coin is also trading 133% above the 200-day simple moving average, which indicates overall sentiment in the cryptocurrency is bullish.
See Also: Could Elon Musk's 'SNL' Hosting Cause A Bump In Tesla Or Dogecoin?
Bulls want to see Dogecoin break up from the symmetrical triangle, which will give it momentum to make a run back towards its all-time high. If it can clear the 69-cent level, Dogecoin will have the opportunity for another blue-sky run.
Bears want to see Dogecoin break down from the symmetrical triangle and lose support of the 21-day EMA near the 55-cent mark and a support area at 54-cents. If Dogecoin loses those two levels as support, it could whimper towards its next support level near $0.44.
DOGE Price Action: Dogecoin was trading at $0.5925 at last check.
© 2025 Benzinga.com. Benzinga does not provide investment advice. All rights reserved.
Trade confidently with insights and alerts from analyst ratings, free reports and breaking news that affects the stocks you care about.