Square Inc. SQ shares traded lower Thursday amid overall market weakness.
The stock, which has exposure to the crypto space, may be moving after Tesla Inc. TSLA announced that it's going to suspend Bitcoin BTC/USD payments. Square also announced Thursday it would begin to allow developers to build on top of the Square Online platform.
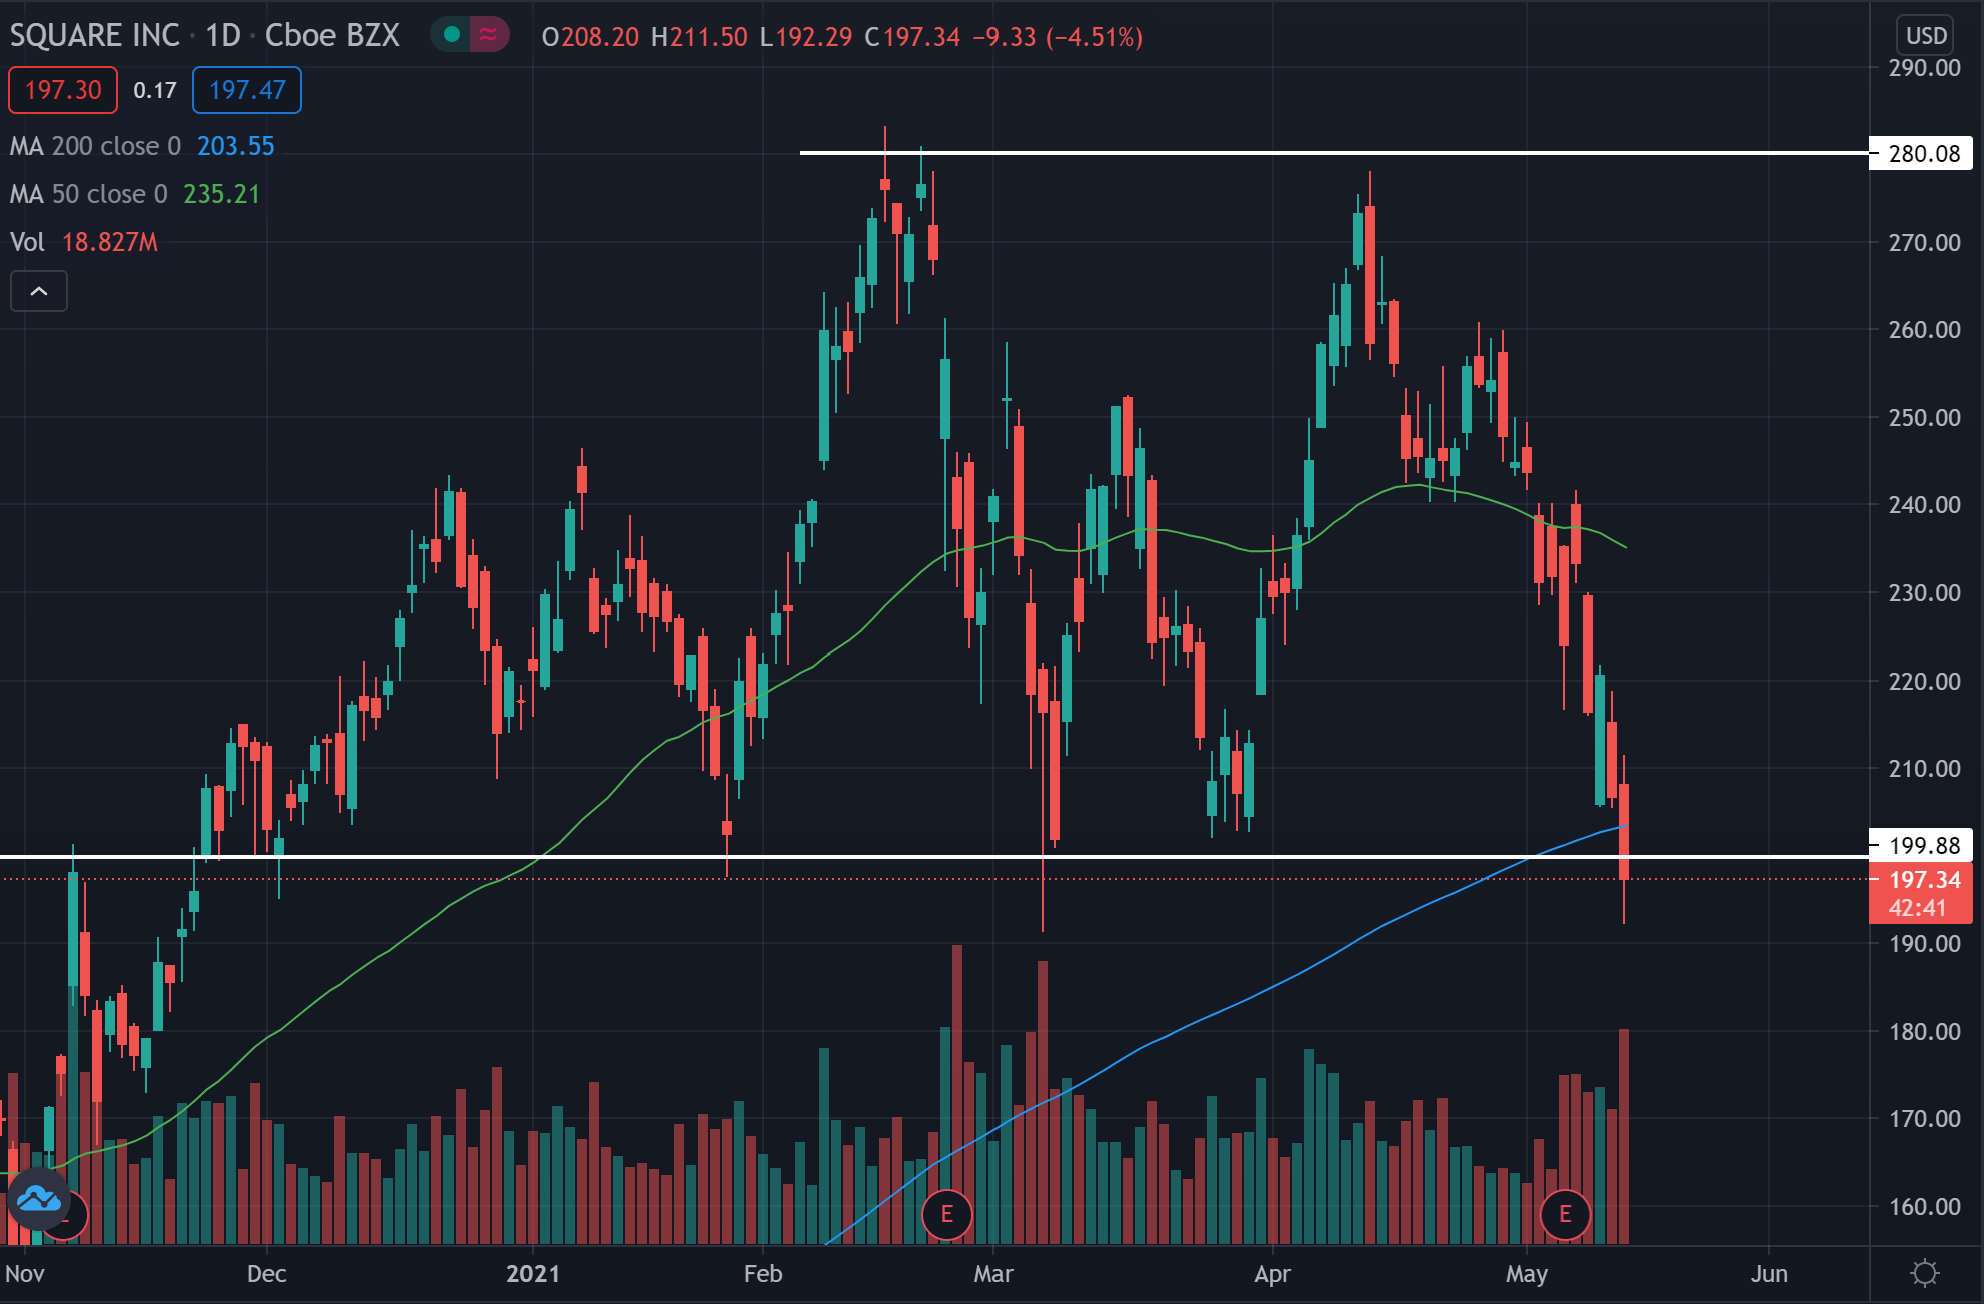
Square closed down 4.6% at $197.13.

Square Daily Chart Analysis
- Square shares might be breaking below the $200 support line after testing this area for the fourth time.
- The stock is trading below the 50-day moving average (green), and crossed below the 200-day moving average (blue) Thursday, indicating sentiment in the stock looks to be turning bearish.
- The price may find resistance near each of these moving averages in the future.
Key Levels To Watch
- The stock is testing the $200 area for the fourth time in recent months.
- The more times a stock touches the support line, the weaker it gets as buyers are unable to push the price back higher.
- If the $200 level can hold as support, the stock may find a strong resistance level near $280 as the stock has peaked near this area twice.
What’s Next?
Bullish technical traders would like to see the stock bounce at the $200 level and start heading higher. Bulls want to see the stock begin to form higher lows and head towards the $280 resistance.
Bearish technical traders would like to see the stock fail to hold the $200 support and start heading lower. If the price is able to consolidate for a time below the support, it may see a stronger push lower.
© 2025 Benzinga.com. Benzinga does not provide investment advice. All rights reserved.
Trade confidently with insights and alerts from analyst ratings, free reports and breaking news that affects the stocks you care about.