Dogecoin DOGE/USD has been on a steady downfall throughout the past few weeks and can't seem to find an area of support.
The crypto has been spiraling downwards alongside some of the other major cryptos such as Bitcoin BTC/USD and looks to find a base. Below is a technical analysis of the Dogecoin chart.
Dogecoin was down 5.6% at $0.1999 at last check.
See Also: How To Buy And Sell DOGE

Dogecoin Daily Chart Analysis
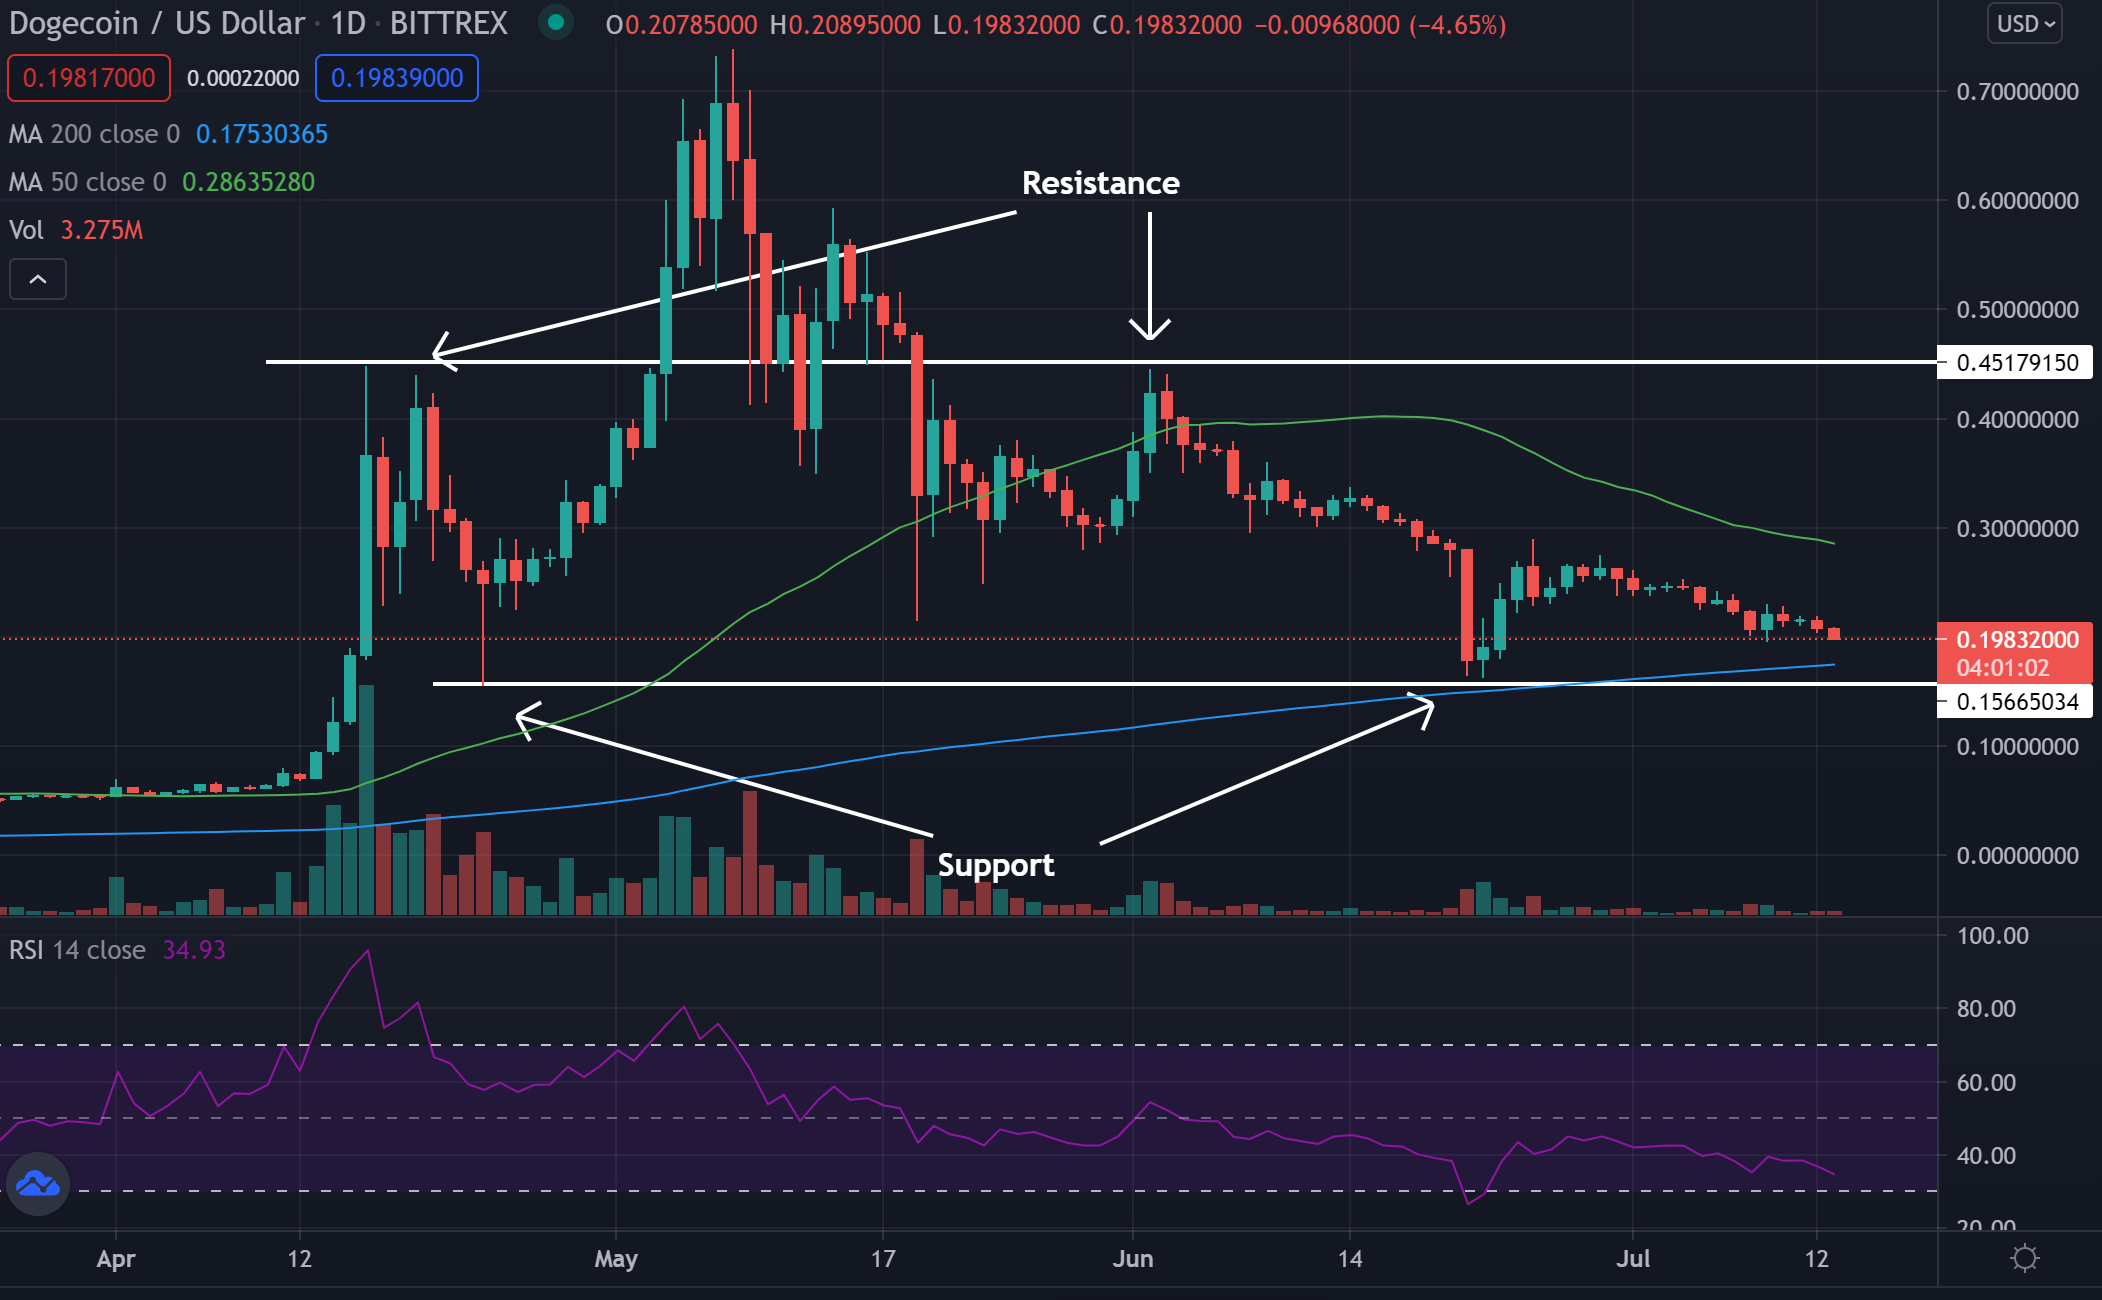
- Dogecoin has been falling the past few weeks and will be looking to find a bounce near potential support soon.
- The crypto is trading below the 50-day moving average (green), but above the 200-day moving average (blue), indicating the crypto is likely in a period of consolidation.
- The 50-day moving average may act as resistance, while the 200-day moving average may hold as an area of support
Key Dogecoin Levels To Watch
- The $0.15 cent level has held as support on two separate occasions before making a bounce back higher. As Dogecoin nears this level again, it has the potential to see a bounce once again.
- If Dogecoin can bounce at support, the crypto’s chart doesn't show strong resistance until the $0.45 level.
What’s Next For Dogecoin?
Bullish traders would like to see Dogecoin bounce near the $0.15 level and start to head higher. Bulls want to see the crypto make higher lows up to the $0.45 resistance before eventually breaking above.
Bearish traders would like to see Dogecoin fall to the $0.15 level and break below holding this area as resistance. If Dogecoin falls below $0.15 and is unable to cross back above it, it may see a strong downward push following.
© 2025 Benzinga.com. Benzinga does not provide investment advice. All rights reserved.
Trade confidently with insights and alerts from analyst ratings, free reports and breaking news that affects the stocks you care about.