Bitcoin BTC/USD is severely undervalued compared to the Bitcoin stock-to-flow (S2F) model, data shows.
What Happened: According to Glassnode, when BTC price dipped under $30,000 on Tuesday, it was only at about 0.27 of the value that it was estimated to have, according to the S2F model.
Such a strong undervaluation cannot be observed anywhere else on Glassnode's charts, and they go as far back as July 2010.
This might be as far as the coin's price has ever been from the estimates.
Why It Matters: Bitcoin's S2F model was released in March 2019 by a Twitter user and anonymous Dutch, investor Plan B, in an attempt to value the coin in a way similar to scarce assets, such as precious metals and limited commodities.
Widely produced commodities, such as copper, are not considered to be a good store of value because of the new supply, while hard-to-produce commodities such as gold are believed to be a better fit.
This model is simply trying to measure this difference in a more objective and precise way — going as far as to give fair price estimates.
S2F quantifies the scarcity that, according to many, makes Bitcoin valuable, dividing the total global supply by the annual production. Bitcoin was programmed to be artificially scarce, limiting the number of coins to be ever be mined — 21 million — and decreasing their rate of production during events called "halvings."
During those events, Bitcoin production is cut in half, and S2F's Bitcoin value estimates jump sharply upwards as a consequence.

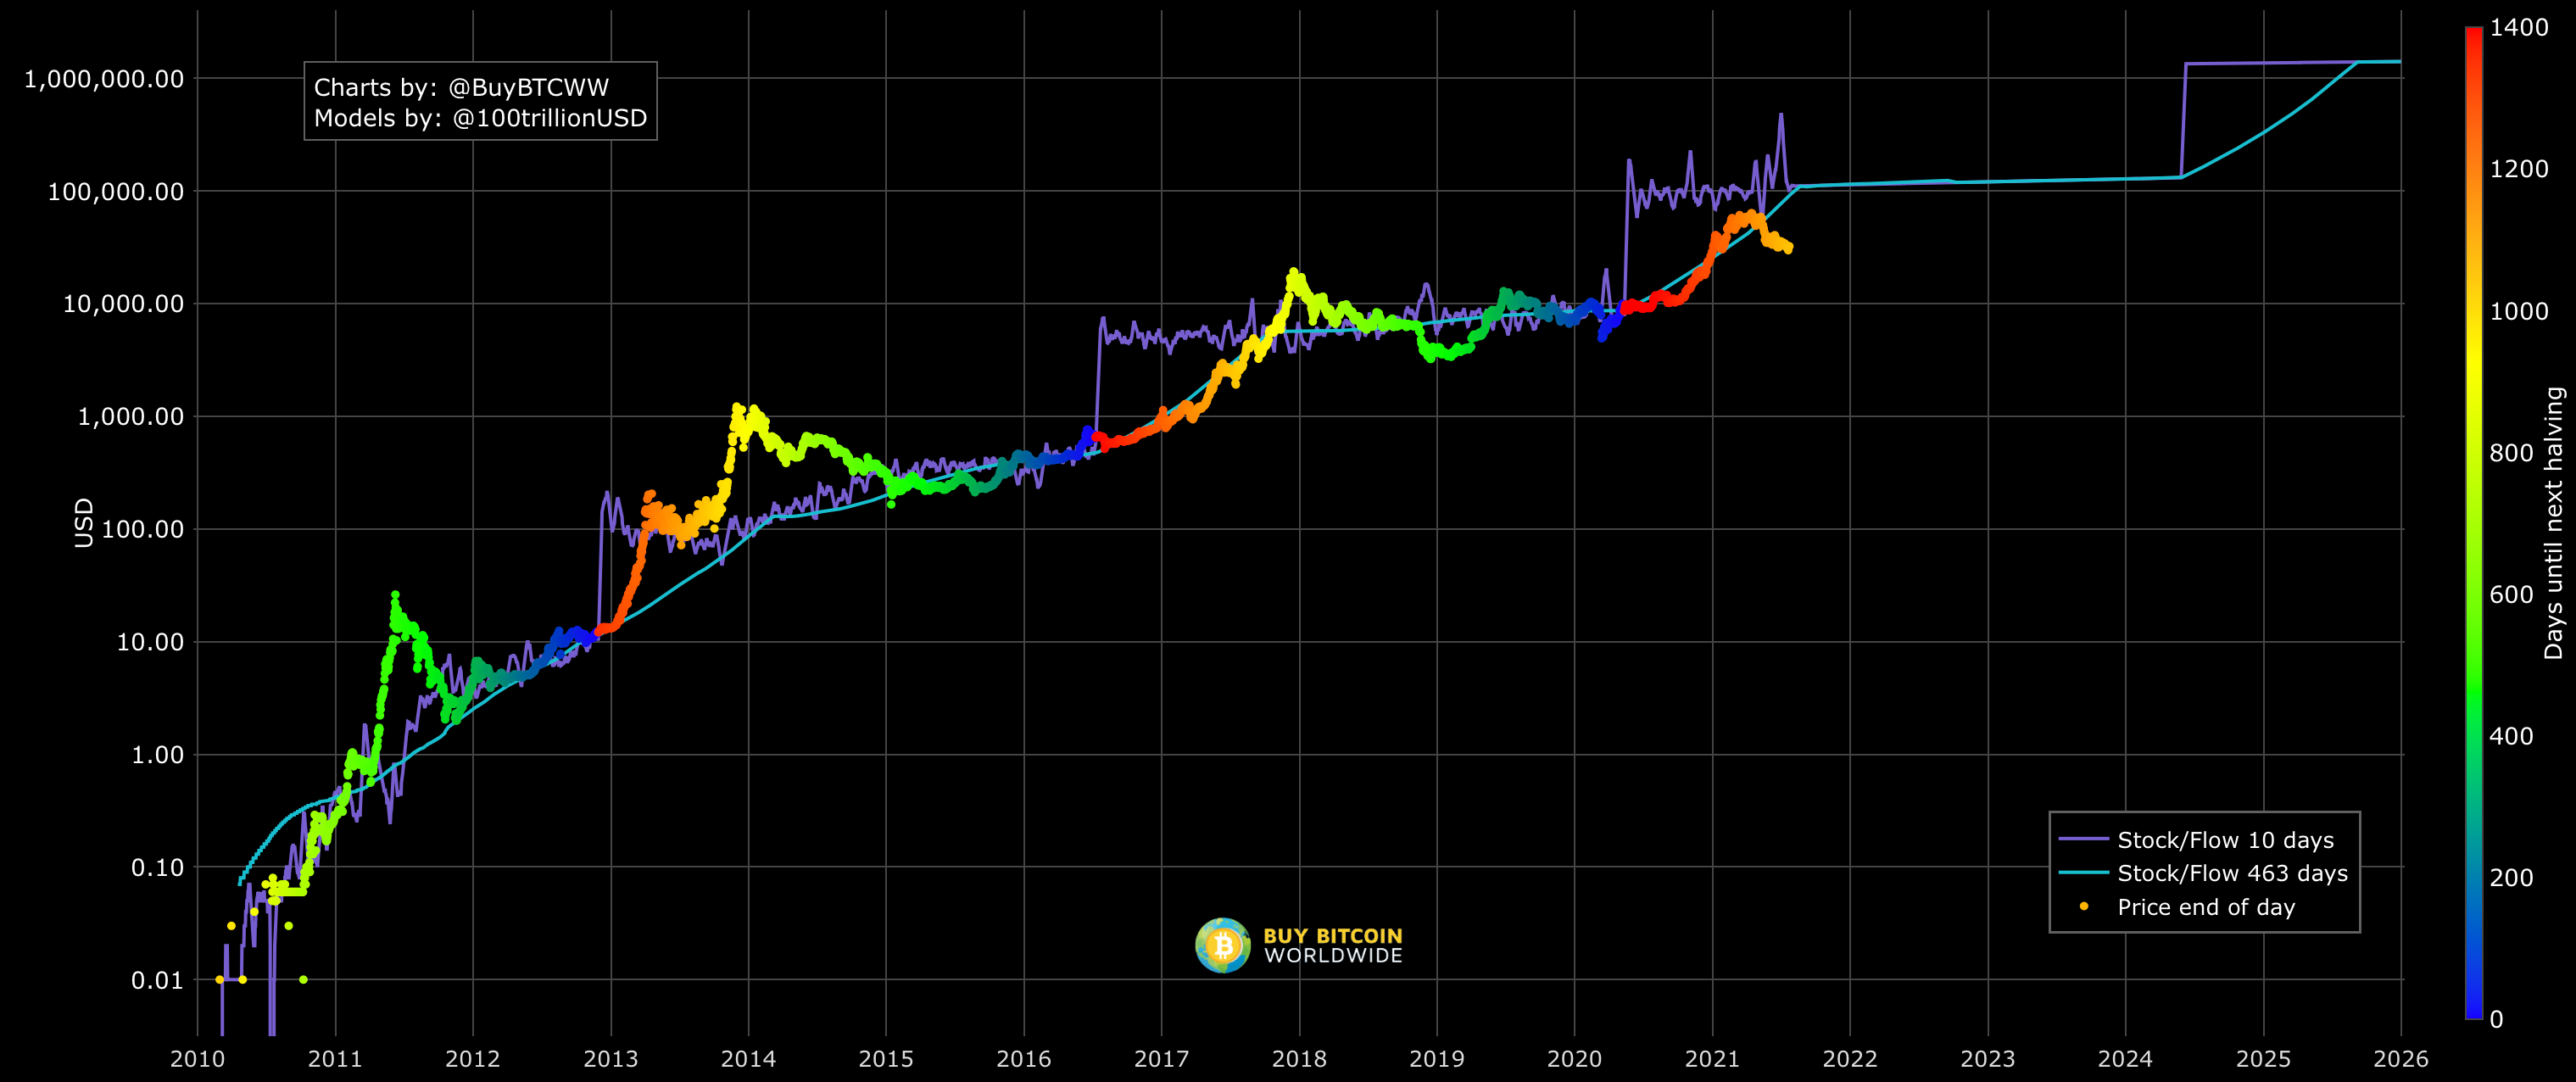
Bitcoin's S2F chart | Courtesy of BuyBitcoinWorldwide
In the chart above, every halving event is symbolized by the Bitcoin’s price indicator becoming blue.
As we can see, historically, every halving event anticipated a major bull run.
Such bull runs usually ended up with Bitcoin exceeding S2F’s price predictions.
Lastly, the correction phase causes the coin’s price to fall under those very same price expectations.
Glassnode data starting in July 2010 indicate that the most undervalued Bitcoin has ever been was at 0.3 in early October 2010, compared to S2F's estimates.
While this may be viewed as a buying opportunity by long-term traders and investors, it must be pointed out that the chart is logarithmic and, while the price has apparently always "orbited," the model shows it has often gone significantly far from it.
Furthermore, PlanB himself admitted that his model might become invalidated if any of the fundamentals that seemingly made it true so far change or a bearish scenario realizes — for instance, a widespread ban drastically decreasing demand.
© 2025 Benzinga.com. Benzinga does not provide investment advice. All rights reserved.
Trade confidently with insights and alerts from analyst ratings, free reports and breaking news that affects the stocks you care about.