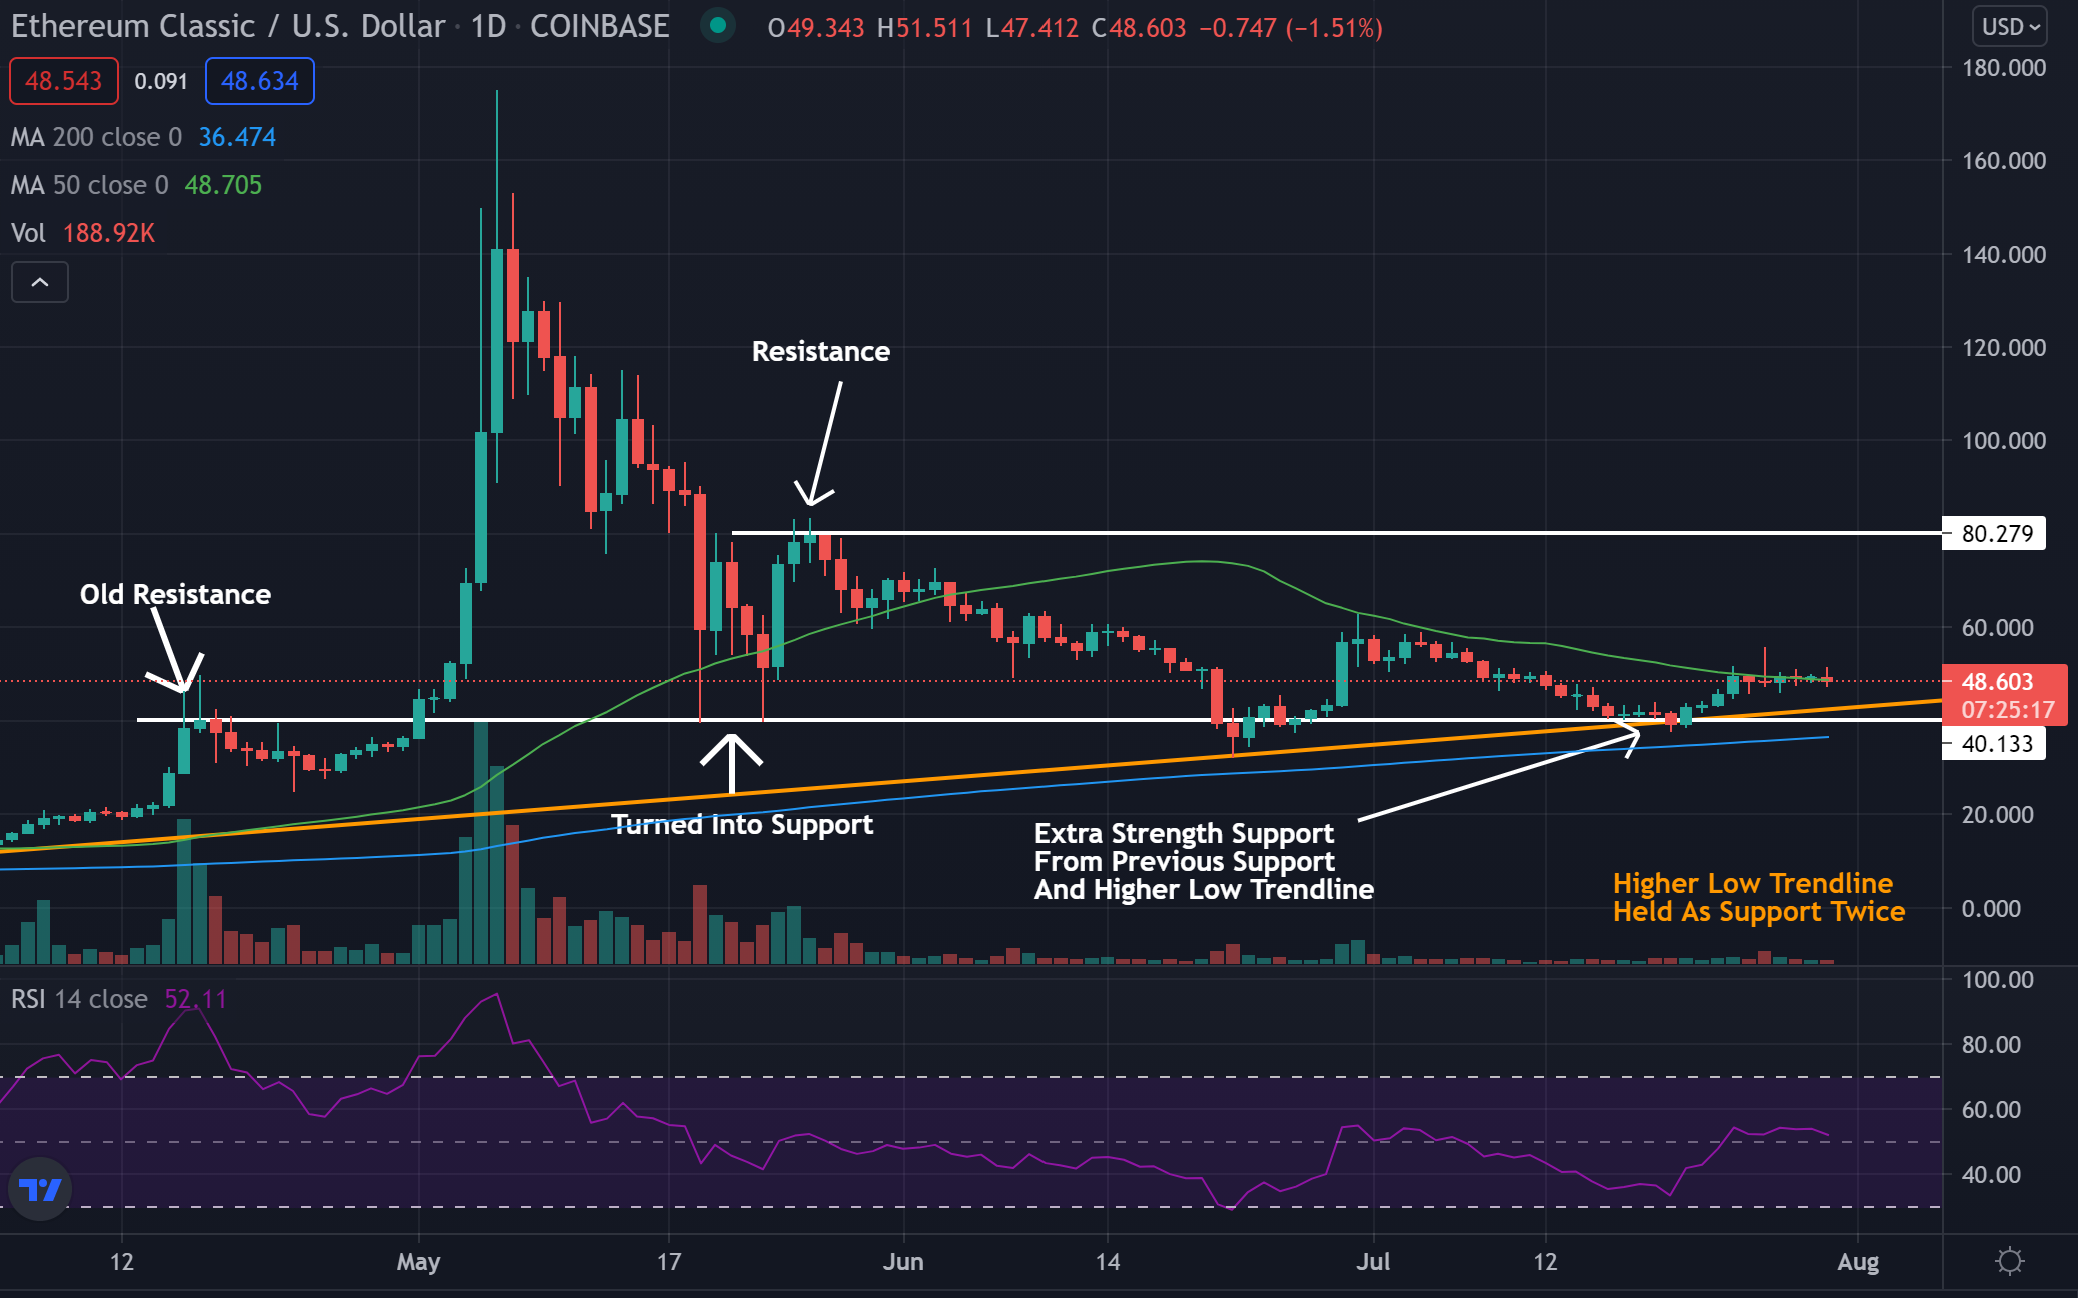
Ethereum Classic ETC/USD shares are moving down Friday, although it looks to have found support.
Ethereum Classic was down 2.17% at $48.28 at last check.

Ethereum Classic Daily Chart Analysis
- The cryptocurrency looks as though it may have found a bounce near support in a sideways channel. It also continues to trade above the higher low trendline.
- The crypto trades below the 50-day moving average (green), but above the 200-day moving average (blue), indicating the crypto may be entering a period of consolidation.
- The 50-day moving average may act as resistance, while the 200-day moving average may hold as support.
- Ethereum Classic is trading in a channel between support of $40 and resistance near $80. These are levels the crypto has struggled to cross in the past. The higher low trendline has also been holding as a support level.
- The Relative Strength Index (RSI) has been moving sideways lately and now sits at 51. This means there have been relatively equal amounts of buyers and sellers in the crypto.
What’s Next For Ethereum Classic?
Bullish traders would like to see Ethereum Classic build higher lows up to the resistance level before breaking out. If the crypto breaks out, bulls then want to see the price hold above resistance.
Bearish traders would like to see Ethereum Classic first fall below the higher low trendline, and then fall below the $40 support level. This could cause the crypto to see a change in trend and sentiment.
See also: How to Buy Ethereum Classic (ETC)
© 2025 Benzinga.com. Benzinga does not provide investment advice. All rights reserved.
Trade confidently with insights and alerts from analyst ratings, free reports and breaking news that affects the stocks you care about.