


Bit Digital Inc. BTBT shares are trading higher Monday, likely moving alongside Bitcoin BTC/USD and Ethereum ETH/USD. The cryptocurrency-related stock typically trades in sympathy with the rest of the cryptocurrency market.
Bit Digital was up 15.56% at $10.40 at last check Monday.
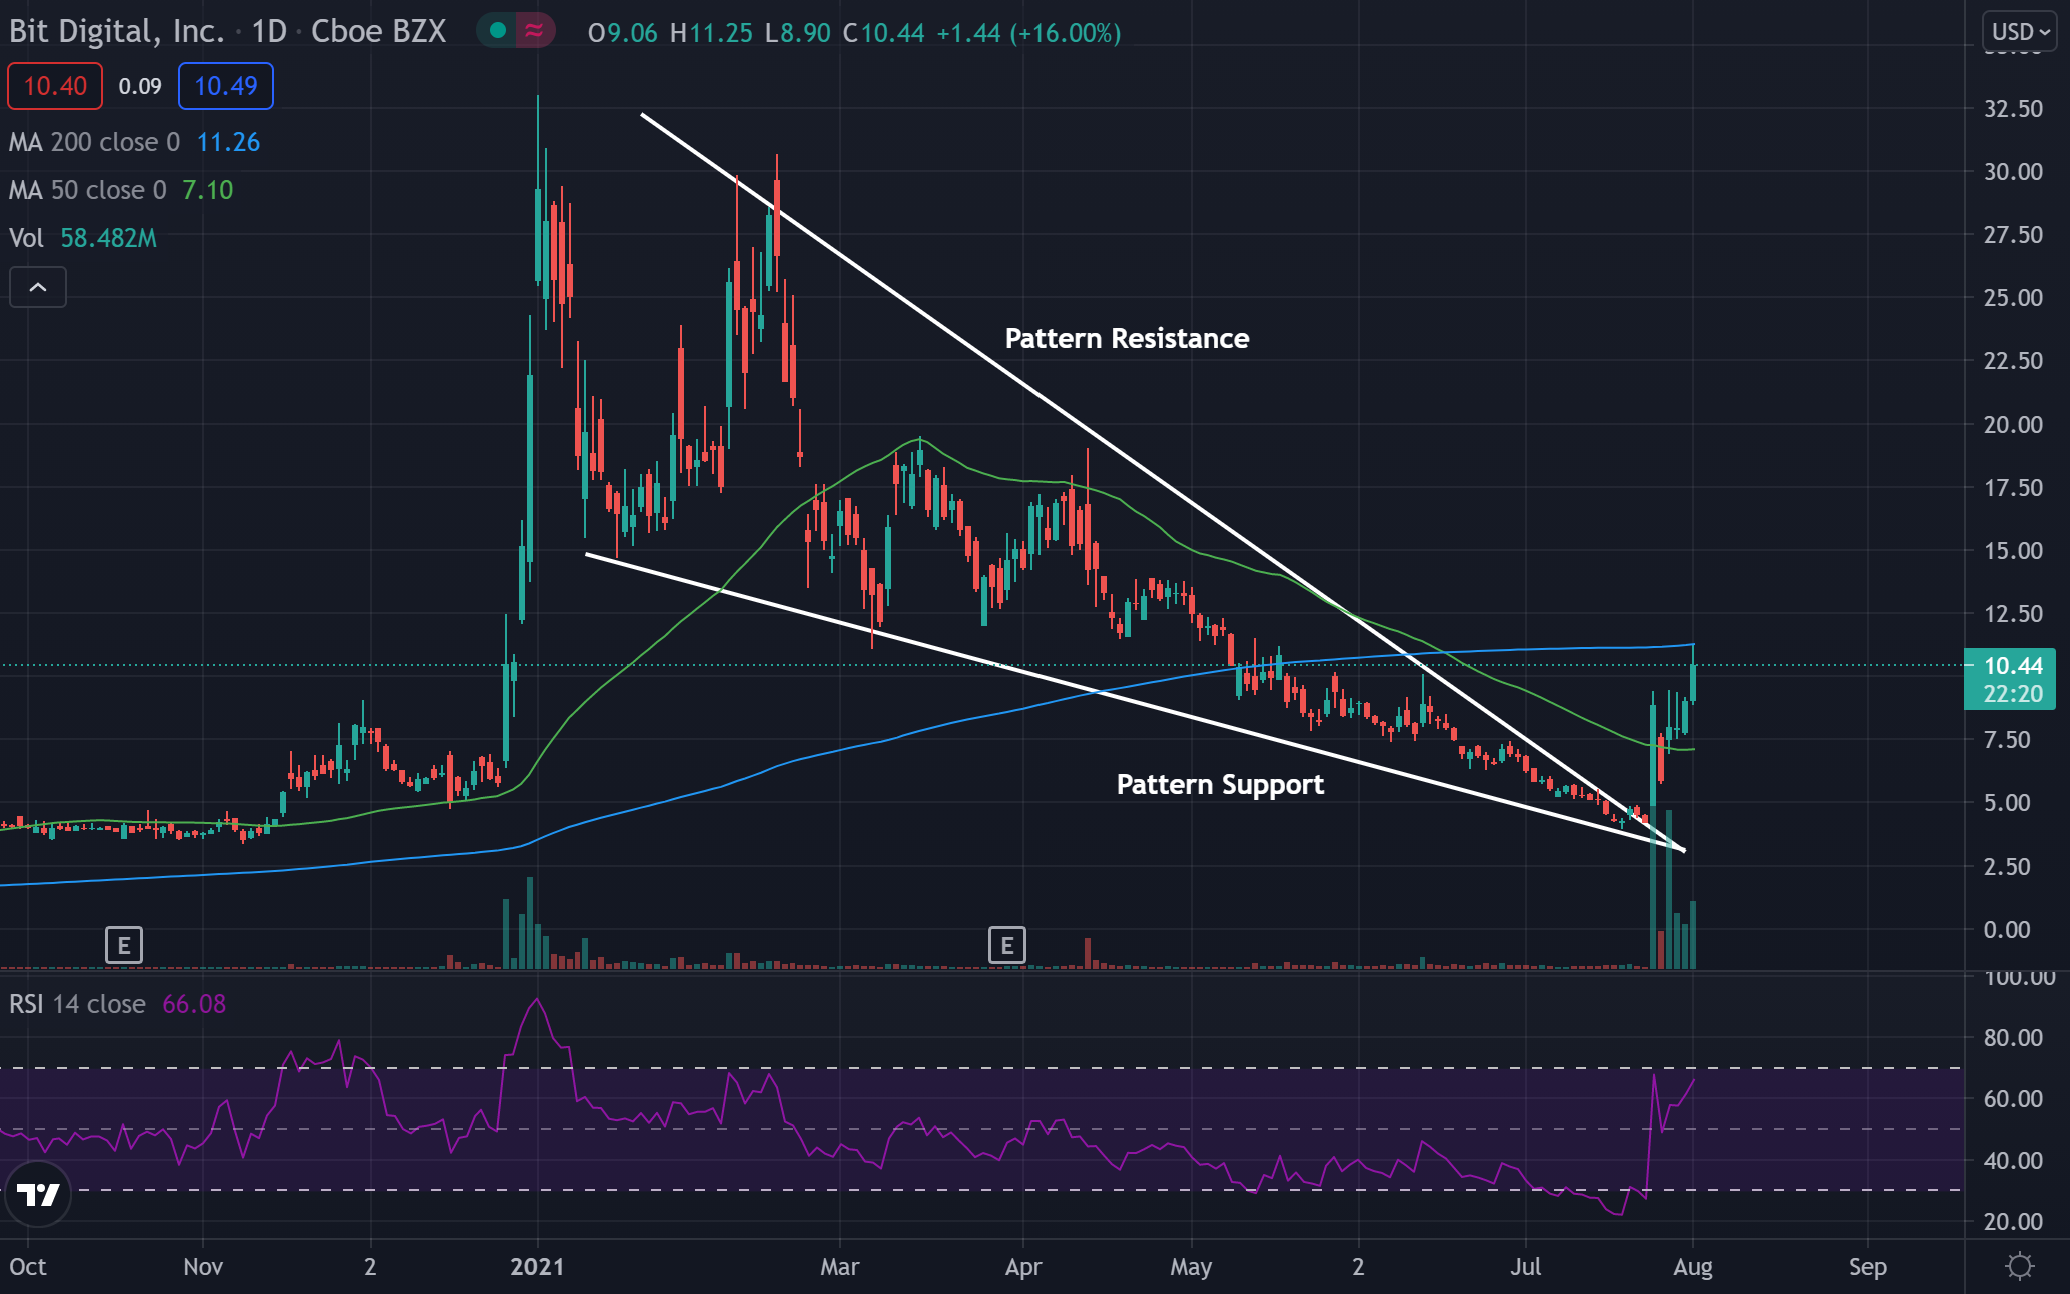
Bit Digital Daily Chart Analysis
- The stock looks to have broken out of what technical traders call a falling wedge pattern.
- The stock trades above the 50-day moving average (green), but below the 200-day moving average (blue), indicating the stock is likely facing a period of consolidation.
- The 50-day moving average may hold as support while the stock may find resistance near the 200-day moving average.
- The price being able to break out and move higher is a good sign for bulls. If the stock can hold its gains and consolidate it may see a higher move.
- The Relative Strength Index (RSI) has been moving higher as the stock has been breaking out and now sits at the 65 level. This means there are more buyers in the stock than sellers and the RSI may enter the overbought range soon if buying continues.
What’s Next For Bit Digital?
Bullish traders are looking to see the stock continue to move higher and form higher lows. Higher lows would show that the stock might be ready to continue higher.
Bearish traders would like to see the stock fall back into the pattern and break below the pattern support. If the stock was able to break below pattern support it could see a further strong bearish push.
Edge Rankings
Price Trend
© 2025 Benzinga.com. Benzinga does not provide investment advice. All rights reserved.
Trade confidently with insights and alerts from analyst ratings, free reports and breaking news that affects the stocks you care about.

