Litecoin LTC/USD is trading higher Wednesday, likely moving with the rest of the bullish cryptocurrency market.
The majority of the market is trading green and Ethereum ETH/USD leads the pack.
Litecoin was up 3.28% at $143.52 at last check Wednesday, while Ethereum was up 9.29% at $2,707.10.

Litecoin Daily Chart Analysis
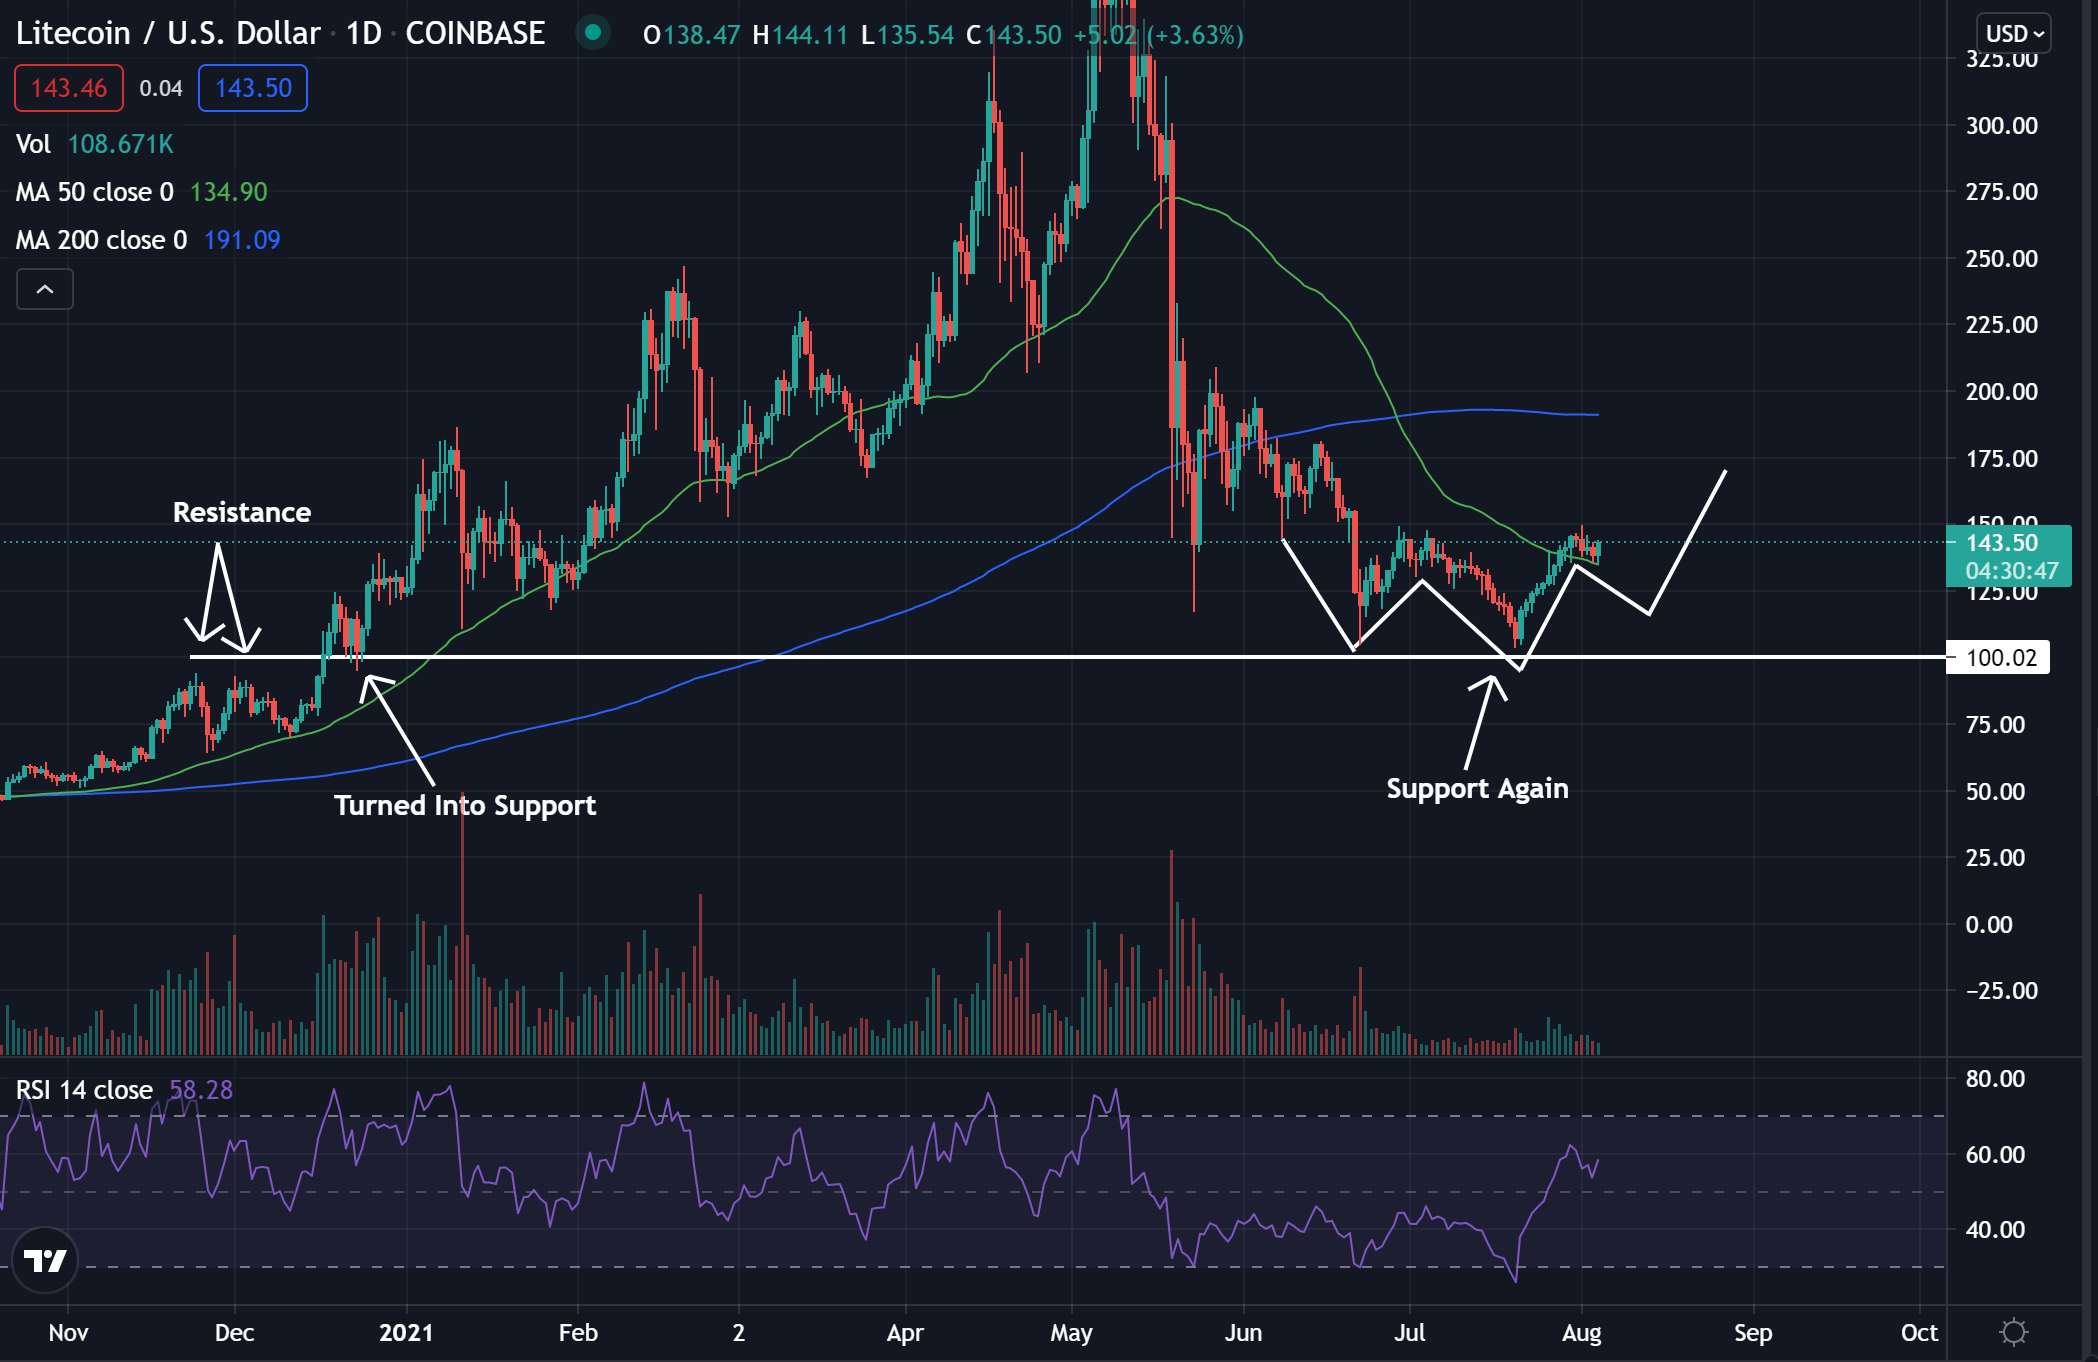
- Litecoin recently bounced near an old support level and looks to be trading in an inverse head and shoulders pattern.
- The crypto trades above the 50-day moving average (green), but below the 200-day moving average (blue), indicating the crypto is likely facing a period of consolidation..
- Litecoin may find support near the 50-day moving average, but the 200-day moving average may hold as a resistance level.
- The $100 level is an area where Litecoin once found resistance, but after breaking above resistance it has been able to hold this level as support.
- The Relative Strength Index (RSI) recently crossed above the 50 mark and now sits at 58. This means there has been more buyers moving into the crypto throughout the past few weeks.
What’s Next For Litecoin?
Bullish traders are looking to see Litecoin finish reversing and continue to move higher. Bulls would then like to see Litecoin form higher lows and form an uptrend.
Bearish traders would like to see Litecoin fall and break below the $100 level. If Litecoin can hold below the $100 level then it may see a further downward push.
See also: How to Buy Litecoin (LTC)
© 2025 Benzinga.com. Benzinga does not provide investment advice. All rights reserved.
Trade confidently with insights and alerts from analyst ratings, free reports and breaking news that affects the stocks you care about.