Following Bitcoin BTC/USD and Ethereum’s ETH/USD flash crash on Sept. 7, on the day El Salvador officially adopted Bitcoin as legal tender, U.K.-based bank Standard Chartered issued fresh price predictions for the two largest cryptocurrencies by market cap. Analysts at the bank see Bitcoin rising three times its current price and Ethereum skyrocketing a potential 10 times.
Geoffrey Kendrick, who leads the global research team at Standard Chartered, also sees Ethereum surpassing Bitcoin’s total value and compared Ethereum to a financial market as opposed to Bitcoin which Kendrick sees more as a currency. Kendrick also highlighted the risks associated with investing in the two cryptos and pointed out the importance of Ethereum’s upgrade to 2.0 not expected to be completed until at least next year.
On Sunday, Bitcoin and Ethereum were working on erasing some of last week’s loses but were battling a variety of moving averages on the daily charts.
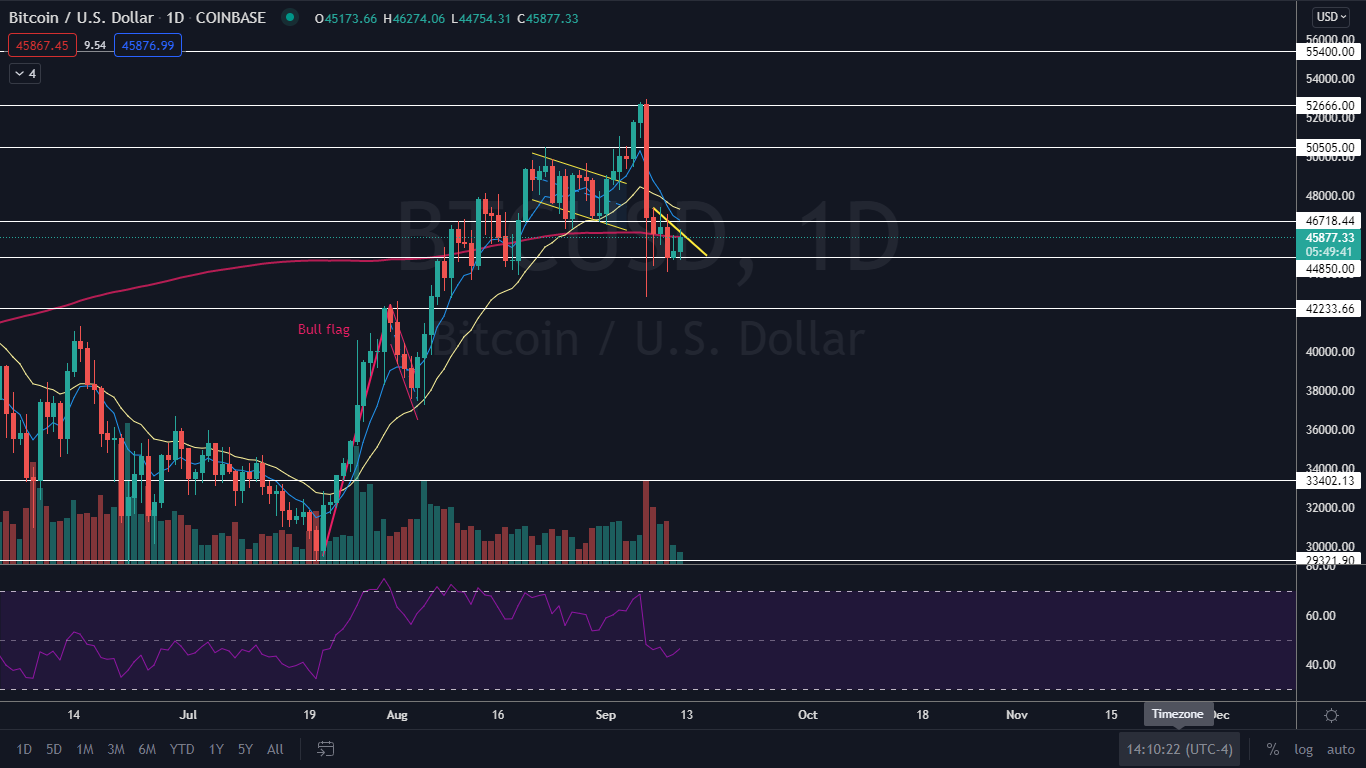
The Bitcoin Chart: After plummeting over 18% on Sept. 7, Bitcoin regained a support level at $44,850 and has since traded sideways in consolidation. On Sunday, Bitcoin was attempting to print a bullish engulfing candlestick which indicates higher prices may come on Monday if the crypto can close the day above the $45,900 level.
During the past five days Bitcoin has settled under a descending trendline and on Sunday tried to break up bullishly from the pattern but failed and wicked from the level. The low trading volume on the crypto indicates more consolidation may be needed for Bitcoin to garner enough strength to make the break.
Bitcoin is trading below the eight-day and 21-day exponential moving averages (EMAs) with the eight-day EMA trending below the 21-day, both of which are bearish indicators. The crypto is battling to close above the 200-day simple moving average, however, and if it can close the day above the level overall sentiment will turn bullish.
Bitcoin has resistance above at the descending trendline, $46,718 and $50,505 while the crypto has support below at $44,850 and $42,223.

See Also: How to Buy Bitcoin
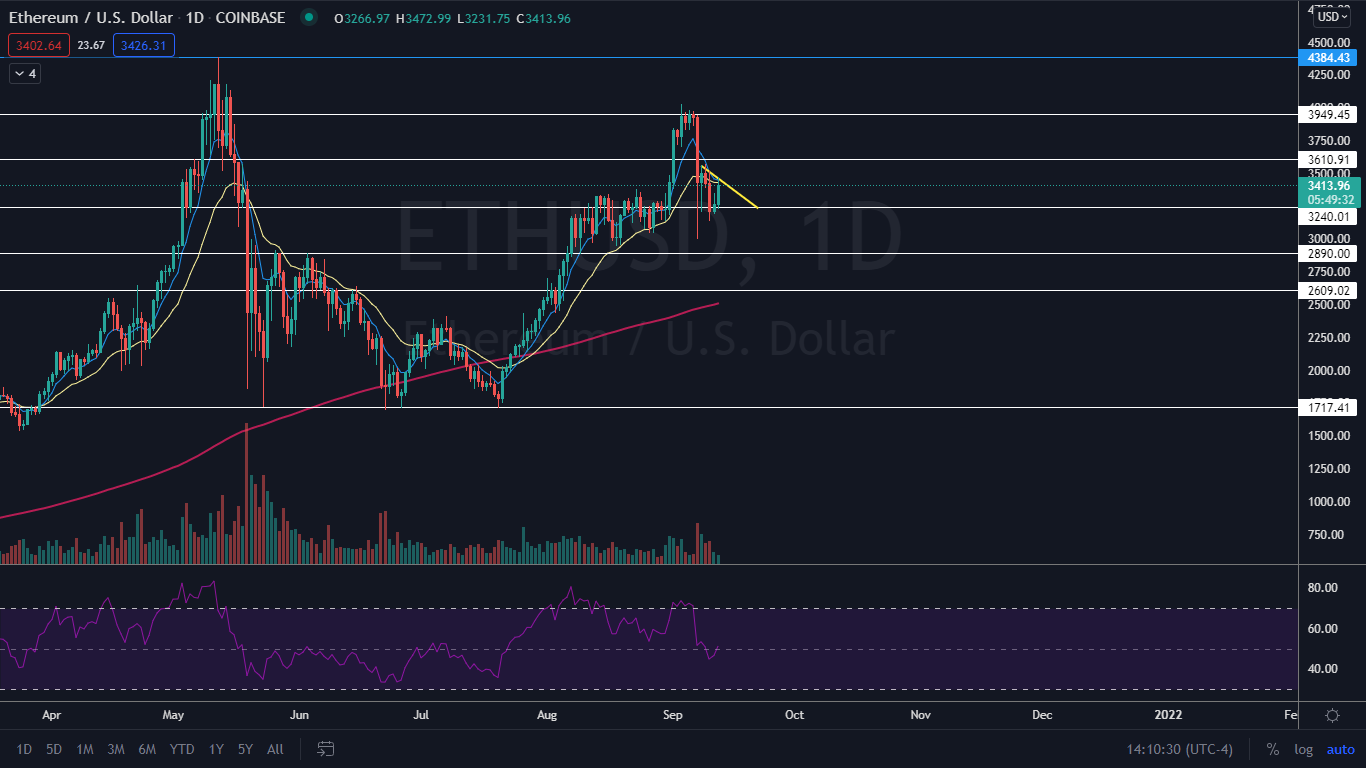
The Ethereum Chart: On Sunday Ethereum was trading up almost 5% higher and working to print a bullish Marubozu candlestick which indicates higher prices may come on Monday. Bulls will want to see Ethereum close the day above Saturday’s high of about $3,350.
Like Bitcoin, Ethereum had remained under a descending trendline and was trying to break bullishly up from it. If Ethereum rises above the trendline bulls will want to watch for big bullish volume to enter the crypto for confirmation the pattern has been recognized.
Ethereum is trading in line with the eight-day and 21-day EMAs with the eight-day EMA trending above the 21-day, both of which are bullish indicators. Both EMAs have also begun to curl upwards which is positive for the bulls. Ethereum is also trading well above the 200-day SMA, which indicates overall sentiment is bullish.
Ethereum has resistance above at the descending trendline, $3,610 and $3,949. The crypto has support below at $3,240 and $2,890.
See Also: How to Buy Ethereum
© 2025 Benzinga.com. Benzinga does not provide investment advice. All rights reserved.
Trade confidently with insights and alerts from analyst ratings, free reports and breaking news that affects the stocks you care about.