Ethereum ETH/USD is trading lower amid a cryptocurrency market that is taking a slight dip.
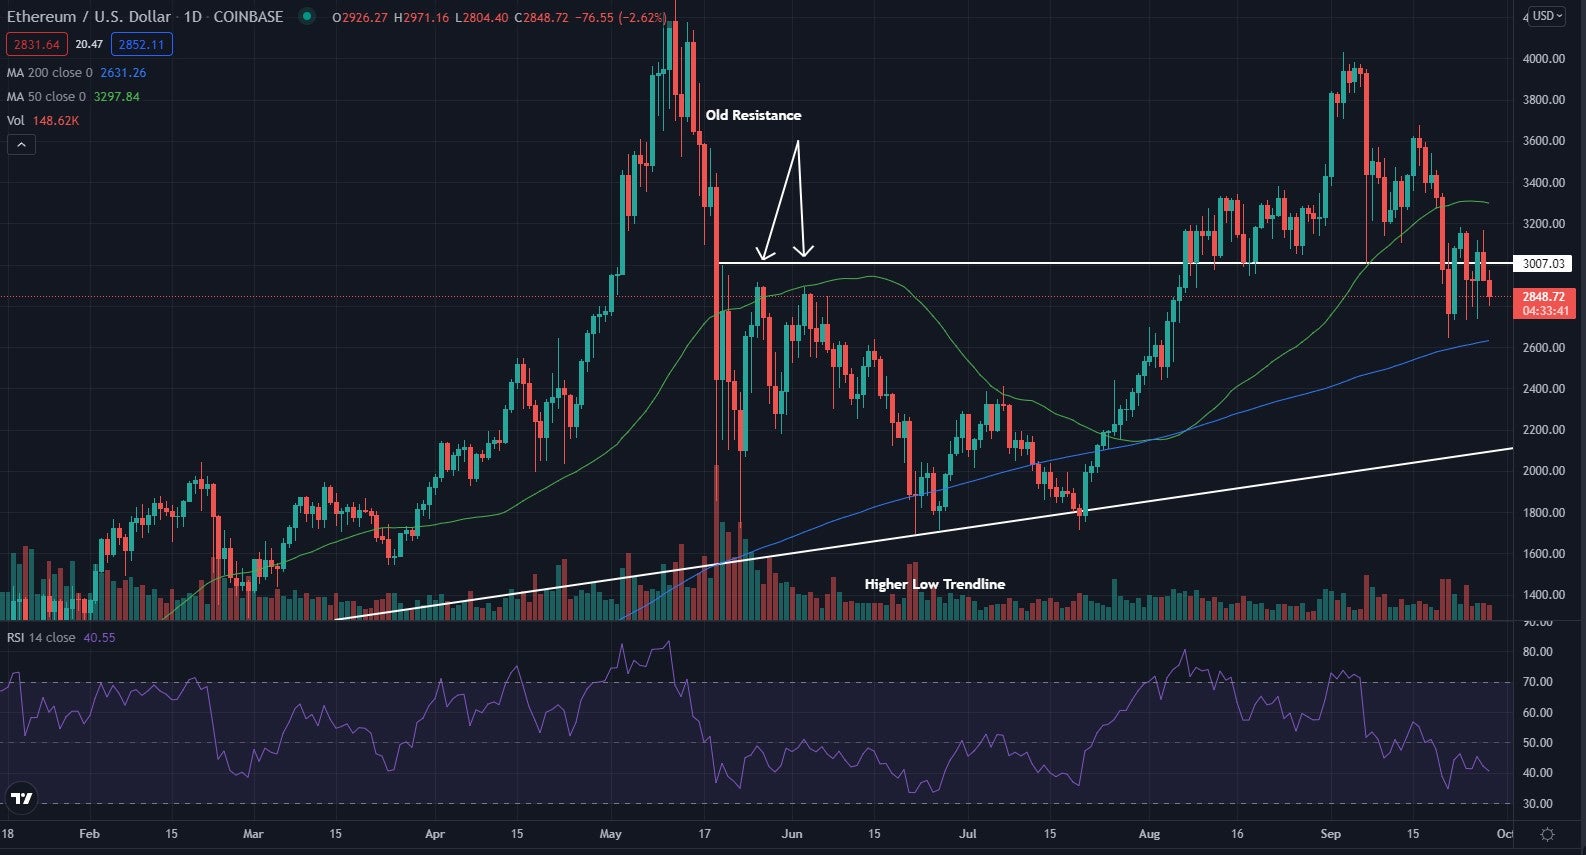
Ethereum recently crossed back below a key level. The key level was once a resistance level, but was trying to turn into a support level.
Ethereum is trading at $2,911.12 at publication time.
Ethereum Daily Chart Analysis
- After breaking out of the ascending triangle pattern, Ethereum was unable to hold the $3,000 level as support.
- The $3,000 level held as resistance, then the crypto broke out and tried to retest the $3,000 level as support, but did so unsuccessfully. Ethereum may fall back toward the higher low trendline where it could find support.
- The crypto trades below the 50-day moving average (green), but above the 200-day moving average (blue), indicating the crypto looks to be in a period of consolidation.
- The 50-day moving average may act as a spot of resistance, while the 200-day moving averages may hold as support in the future.
- The Relative Strength Index (RSI) has been fading lower the past few weeks and now sits at 40. This shows there is more selling pressure than buying pressure in the crypto in the past couple of weeks.

What’s Next For Ethereum?
Bullish traders are looking to see Ethereum bounce and cross back above the $3,000 level. If the crypto can cross back above this level and hold it as support, it may be able to continue on the run it was on.
Bearish traders want to see Ethereum drop back down to the higher low trendline and then be able to hold below the trendline. This could cause a possible change in trends and for a long-term downtrend to begin.
Edge Rankings
Price Trend
© 2025 Benzinga.com. Benzinga does not provide investment advice. All rights reserved.
Trade confidently with insights and alerts from analyst ratings, free reports and breaking news that affects the stocks you care about.