Shares of Robinhood Markets, Inc HOOD spiked about 1.35% higher at 12:20 p.m. ET on Monday after @FirstSquawk said on Twitter he had heard from a source the financial services company planned to list Shiba Inu SHIB/USD to its platform.
At 1:30 p.m. Robinhood responded on the social media platform to say it had not made an announcement regarding SHIB or any other upcoming coins.
Robinhood currently has seven cryptocurrencies available on its platform but is expected to begin testing its new cryptocurrency wallet features this month, which will allow users to transfer their positions to and from other wallets.
See Also: When Will Shiba Inu Hit Robinhood?
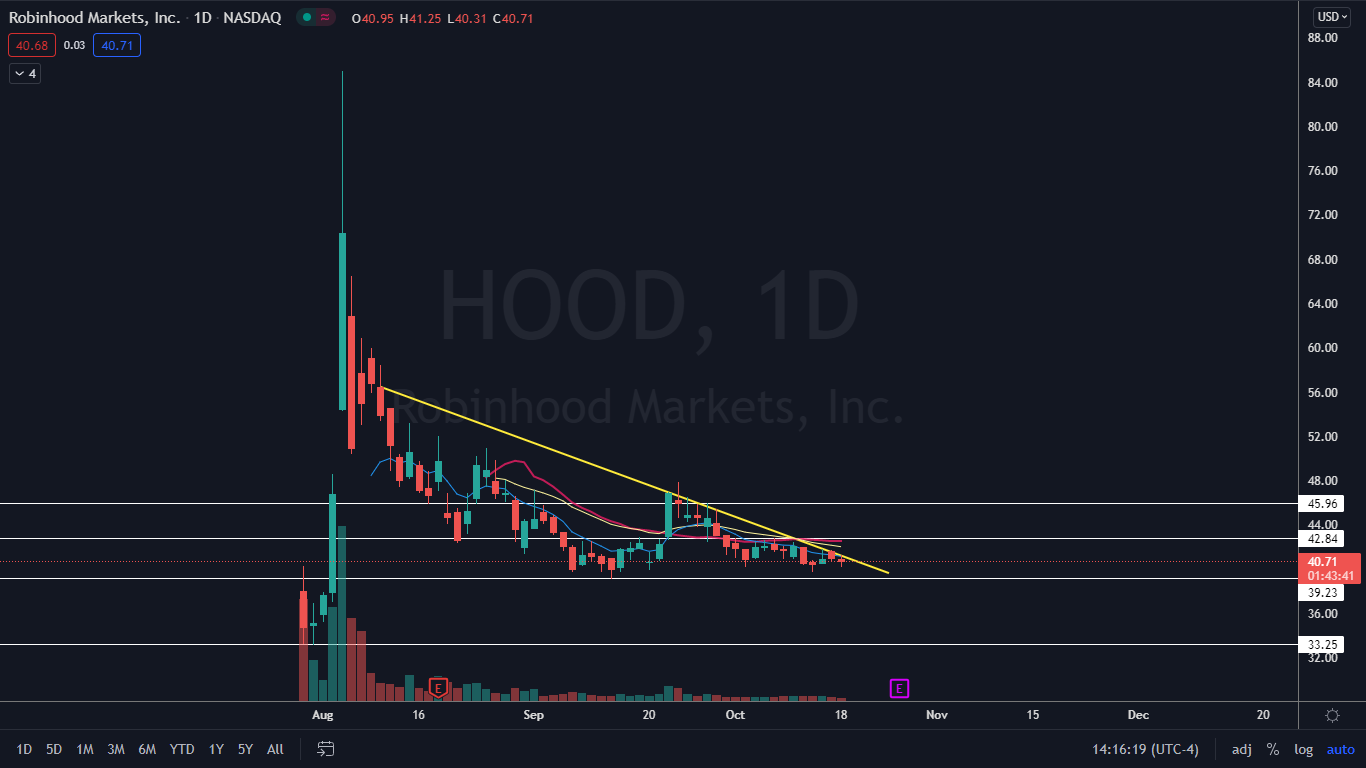
The Robinhood Chart: The spike in Robinhood stock was not enough to pop it up over a descending trendline that has been holding the stock down since Aug. 10. Over the course of the last 19 trading days, Robinhood has tested the trendline as support on nine separate occasions but failed to break up above it.
Although the stock continues to make lower lows on the daily chart, Robinhood found a bottom on Sept. 14 at the $39.23 level and hasn’t made any lower lows below the level. This has caused Robinhood’s daily trading range to significantly tighten and indicates a break in direction is on the horizon.
Robinhood is trading just below the eight-day and 21-day exponential moving averages (EMAs), with the eight-day EMA trending below the 21-day, both of which are bearish indicators. The stock is also trading below the 20-day simple moving average, which is bearish. If Robinhood is able to break up from the descending trendline, it will be able to easily regain the moving averages as support.
- Bulls want to see big bullish volume come in and break Robinhood up from the descending trendline, which will give the stock the ability to make a run toward a resistance level at $42.84. If Robinhood can regain the level as support, it has room to trade up toward the $45.96 mark.
- Bears want to see big bearish volume come in and drop Robinhood below the key support level at $39.23. Below the area, there is not much support until the stock’s all-time low of $33.25.

Edge Rankings
Price Trend
© 2025 Benzinga.com. Benzinga does not provide investment advice. All rights reserved.
Trade confidently with insights and alerts from analyst ratings, free reports and breaking news that affects the stocks you care about.