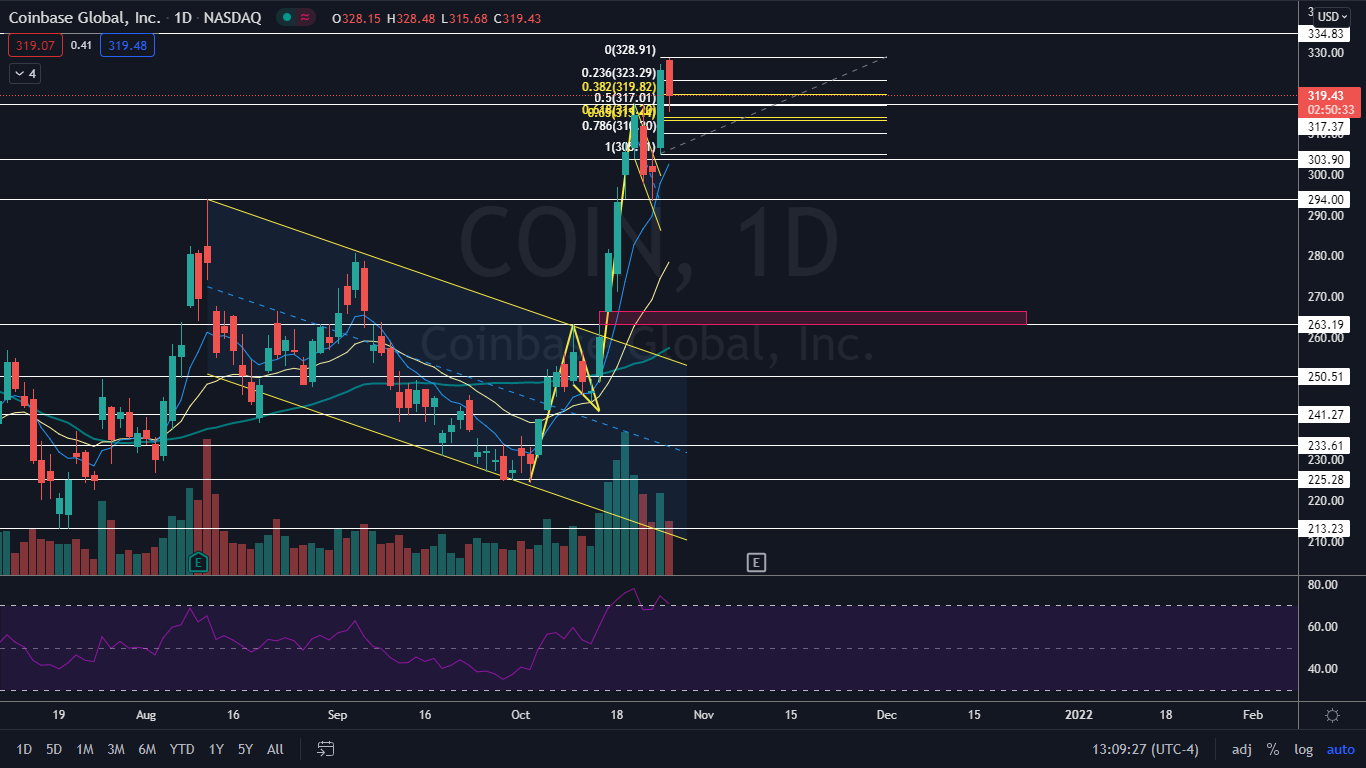
On Monday, Coinbase Global, Inc COIN broke up from a bull flag pattern Benzinga called out and on Tuesday the stock hit a high of $328.48 before beginning to consolidate.
Citi analyst Peter Christiansen initiated coverage of the stock with a Buy rating and a price target of a whopping $415, which is about 30% above where the stock is currently trading at. The analyst believes Coinbase’s stock gives retail and institutional investors exposure to the increased adoption of Bitcoin BTC/USD and other cryptocurrencies.
The risk in Coinbase comes from its trading relationship to the cryptocurrency sector as a whole, however, which can fluctuate wildly. Christiansen believes this could cause Coinbase to make a series of higher highs and lower lows on its ascent.
See Also: How to Buy Coinbase Stock Right Now
The Coinbase Chart: Since reaching a low of $224.51 on Oct. 4 Coinbase has soared up over 46%, while Bitcoin is currently trading about 32% higher over the same time period. On Tuesday both Coinbase and Bitcoin were consolidating on the daily chart.
During Coinbase’s steep climb higher, the stock has created two bull flag patterns, with the first formed between Oct. 4 and Oct. 15 and the second between Oct. 14 and Oct. 22. Coinbase may attempt to set up a third bull flag pattern but Wednesday’s and possibly Thursday’s candles will need to print for confirmation.
On Tuesday, Coinbase’s retracement took it almost to the golden pocket when using a Fibonacci retracement tool before popping back up above the 0.382 level. Traders will want to watch for Coinbase to close the day above the 0.5 retracement level if Coinbase is going to settle into another bull flag pattern before a move higher.
Coinbase has a gap below between $262.96 and $266.53. Because gaps on charts fill about 90% of the time it's likely Coinbase will trade down into the range in the future, although it could be an extended amount of time before that happens.
Want direct analysis? Find me in the BZ Pro lounge! Click here for a free trial.
The consolidation on Tuesday has also helped to slightly cool Coinbase’s relative strength index which was running hot at almost 75% on Monday. When a stock’s RSI reaches or exceeds the 70% level, it can be a sell signal for technical traders.
Coinbase is trading above the eight-day and 21-day exponential moving averages (EMAs), with the eight-day EMA trending above the 21-day, both of which are bullish indicators. The stock is also trading well above the 200-day simple moving average, which indicates longer-term sentiment is bullish. It should be noted that Coinbase is extended from all three moving averages and further consolidation may be needed to allow them to catch up.
- Bulls want to see continued consolidation and then for big bullish volume to come in and break Coinbase up above the high of $328.48. Above the level, Coinbase has resistance at $334 and another level of psychological resistance at $350.
- Bears want to see big bearish volume drop Coinbase down below the golden pocket, which would negate the possible bull flag. Coinbase has support below at $317.37 and $303.90.

© 2025 Benzinga.com. Benzinga does not provide investment advice. All rights reserved.
Trade confidently with insights and alerts from analyst ratings, free reports and breaking news that affects the stocks you care about.