Litecoin LTC/USD has been flying higher the past few days and is trading higher Wednesday as the crypto market sees a bullish push.
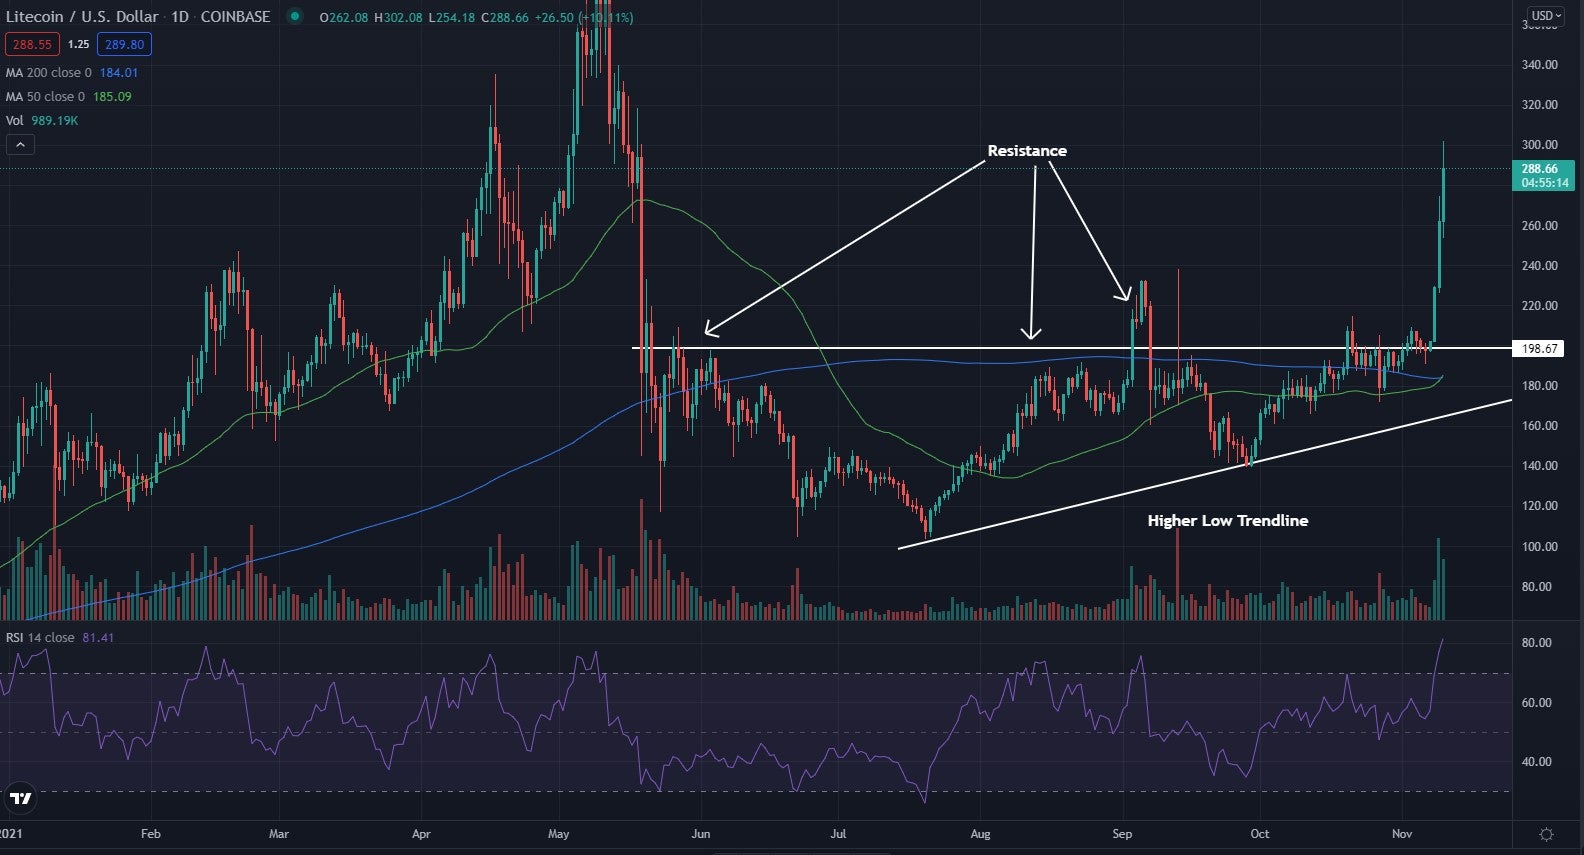
The coin recently broke out of an ascending triangle pattern while forming a golden cross and saw a strong bullish push that could turn into all-time highs if it continues.
Litecoin was up 4.30% at $278.90 Wednesday afternoon at publication.
Litecoin Daily Chart Analysis
- Litecoin saw a breakout and has pushed over 33% higher since breaking above resistance. The coin may need a period of consolidation before continuing on its run.
- The $200 level has been an area where the crypto’s price is unable to hold above for long. This area of resistance may now turn into support if the coin is ever able to fall back this low once again. The higher low trendline may continue to act as support later in the future.
- The crypto trades above both the 50-day moving average (green) and the 200-day moving average (blue), indicating the crypto is seeing bullish sentiment.
- Each of these moving averages may hold as an area of support in the future.
- The Relative Strength Index (RSI) has been flying higher and now sits at 81 on the indicator. This is well into the overbought range showing that the crypto has seen a ton of buying pressure compared to selling pressure throughout the past few days.
See Related: Litecoin Looks To Be On The Verge Of A Breakout And Could Start Moving In The Coming Days

What’s Next For Litecoin?
Bullish traders should take note Litecoin is going through a golden cross where the 50-day moving average crosses above the 200-day moving average. This is a sign there may be good things to come in the future for the crypto, though it may need a period of consolidation before continuing to push higher.
Bearish traders are looking to see the crypto start to cool off and start dropping back toward the $200 level. Bears also are hoping to see the golden cross be unable to happen as well, then they would like to see the 50-day moving average start to fall lower and push away from the 200-day moving average.
Photo: Michael Fortsch via Unsplash
Edge Rankings
Price Trend
© 2025 Benzinga.com. Benzinga does not provide investment advice. All rights reserved.
Trade confidently with insights and alerts from analyst ratings, free reports and breaking news that affects the stocks you care about.