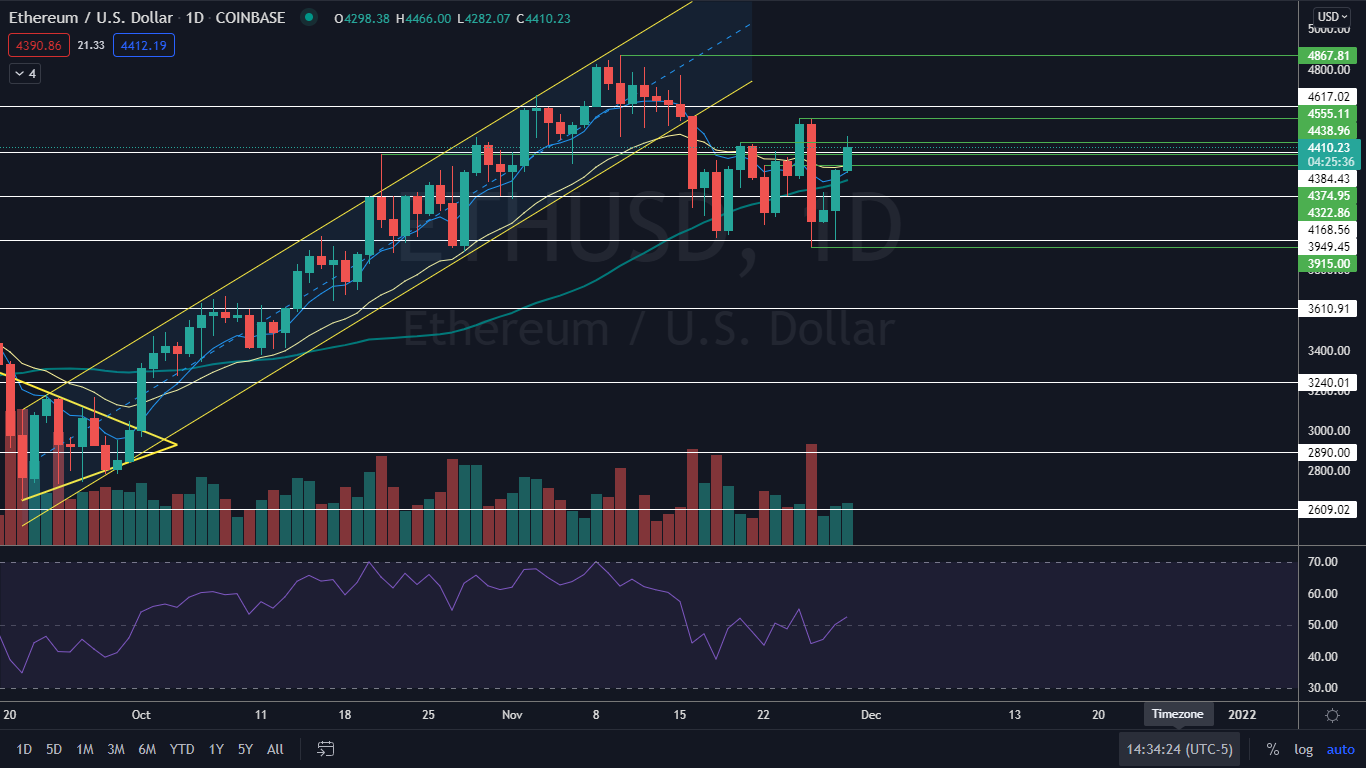
On Nov. 25, Ethereum ETH/USD continued in its uptrend Benzinga called out on Nov. 23 and made a high of $4,555.11, surpassing the previous Nov. 20 high of $4,439.96.
The crypto then printed a bearish double top pattern at the level on Nov. 26 and fell to retest support at the $3,950 level.
The cryptocurrency market has been in a weeks-long period of consolidation after both Bitcoin BTC/USD and Ethereum made new all-time highs of $69,000 and $4,867.81, respectively, on Nov. 10. The pullback put a snag in some investor’s beliefs Bitcoin could rally toward the $100,000 mark by the end of 2021.
In December 2020, a leaked document showed one Citi bank senior analyst predicted Bitcoin could rise as high as $318,000 by December of this year, a price that even for the most bullish investors seems unbelievable now.
As recently as Oct. 21, Nick Spanos, creator of the Bitcoin Center NYC and co-founder of Zap.org, gave Ethereum a price target of between $10,000 to $12,000 by the end of 2021, which seems impossible with only a little over a month left in the year.
Ethereum could rally to a new all-time high before the year is done, however, if the crypto can reverse course into another uptrend and pop over a resistance level at $4,617.02.
See Also: How to Buy Ethereum Classic
The Ethereum Chart: On Nov. 16, Ethereum broke down bearishly from a rising channel in which the crypto had been trading since Sept. 21. The breakdown occurred on higher-than-average daily trading volume, which indicated the pattern had been recognized, and consequently Ethereum retraced more than 13% lower before hitting a bottom near the $4,170 level Nov. 18.
Ethereum has since tested the level as support on four separate occasions, which has created a bullish quadruple bottom pattern at the level. Sunday and Monday’s bullish price action may be the confirmation the pattern was recognized. Over the course of the two 24-hour trading sessions, Ethereum has shot up over 11% from the support level.
The crypto has failed to confirm either an uptrend or a downtrend since printing the double top pattern, but if Ethereum can surpass the Nov. 25 and Nov. 26 high-of-day prices, it will be the first step in forming a possible uptrend.
Bullish traders should remember if the crypto is able to print a higher high, it will also need to print a higher low to confirm the trend.
Ethereum is trading above the eight-day and 21-day exponential moving averages (EMAs), but the eight-day EMA is trending below the 21-day. If Ethereum is able to trade high over the coming days, the eight-day EMA will cross back above the 21-day, which would be bullish. Ethereum is trading above the 50-day simple moving average, which indicates longer-term sentiment is bullish.
- Bulls want to see big bullish volume come in and push Ethereum up to print a higher high and then for continued momentum to pop the crypto up over the higher resistance, which would put Ethereum in reach of it previous all-time high.
- Above the level, there is no further resistance in the form of price history.
- Bears want to see Monday’s bullish price action form a higher low and then for big bearish volume to come in and drop the crypto down below the Nov. 26 low of $3,915. Ethereum has support near $4,384 and $4,168.

Want direct analysis? Find me in the BZ Pro lounge! Click here for a free trial.
Edge Rankings
Price Trend
© 2025 Benzinga.com. Benzinga does not provide investment advice. All rights reserved.
Trade confidently with insights and alerts from analyst ratings, free reports and breaking news that affects the stocks you care about.