From my previous articles, you will have picked up that I do not trade or invest in the indices.
The S&P 500, the Nasdaq 100 and the Dow 30 are averages of a group of stocks. I use them to guide me in market conditions and then scan for and analyze stocks that are performing better than the average in a bull trend and add those to the portfolio.
I use BTC in the same way. It is an indicator for market conditions in cryptos that will then guide me in how the AltCoin market will pan out. I have a portfolio that I am building with interesting IDOs that have the potential to explode following the next bull run on BTC.
I do, however, have ETH in my portfolio. ETH closely follows BTC, with some even arguing it is the primary indicator of the crypto market compared to BTC. I like to remove attachments and guesswork as much as possible, as this brings little benefit long-term. Instead, I use them in unison.
I first invested in ETH in the initial bull run in 2017. I sold for excellent profit and bought back in at $800 in 2018. I then had to apply patience as the market tanked, but with ETH now approaching $5,000, my patience has been rewarded.
Let's dive into the technicals, starting with BTC. With the amount of data that we now have on both BTC and ETH, I apply the same technical analysis process I use to identify market conditions in stocks, commodities and currencies.
Bitcoin
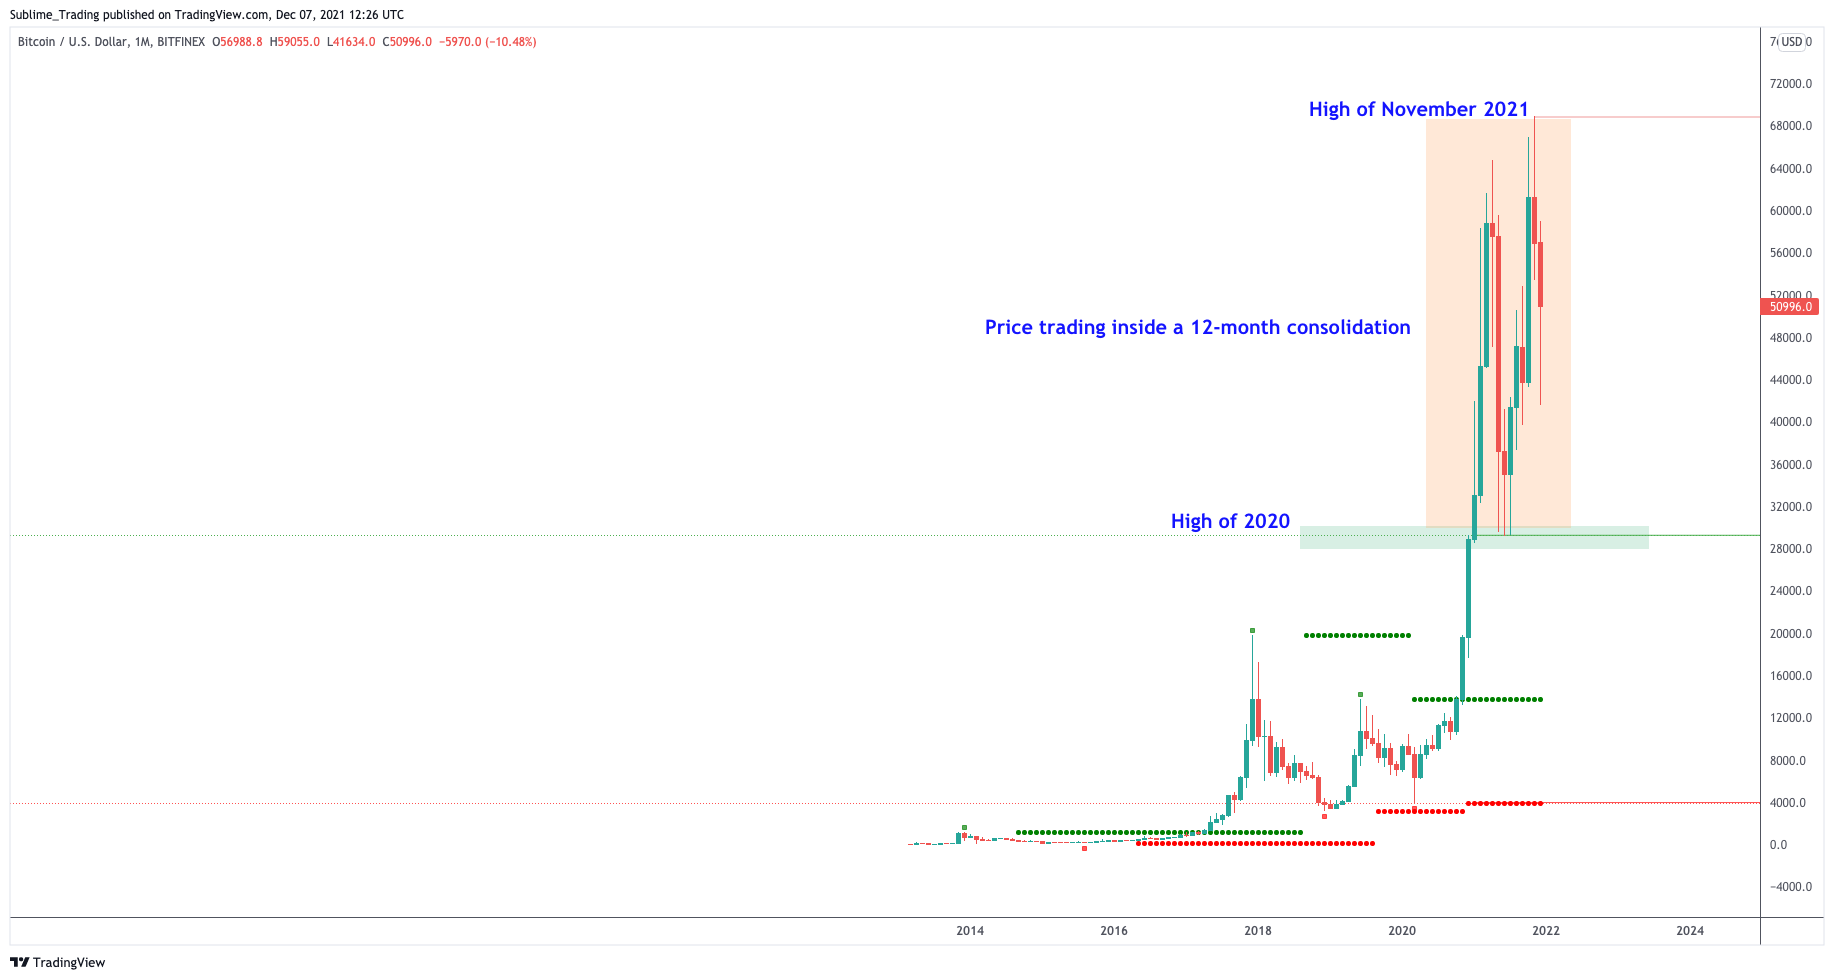
Starting with the monthly timeframe below, Bitcoin's price is trading above the high of last year but below the current ATH of April 2021. I view this as price having an overall bullish bias but trading inside a 12-month consolidation. This means I favor a breakout to the upside.

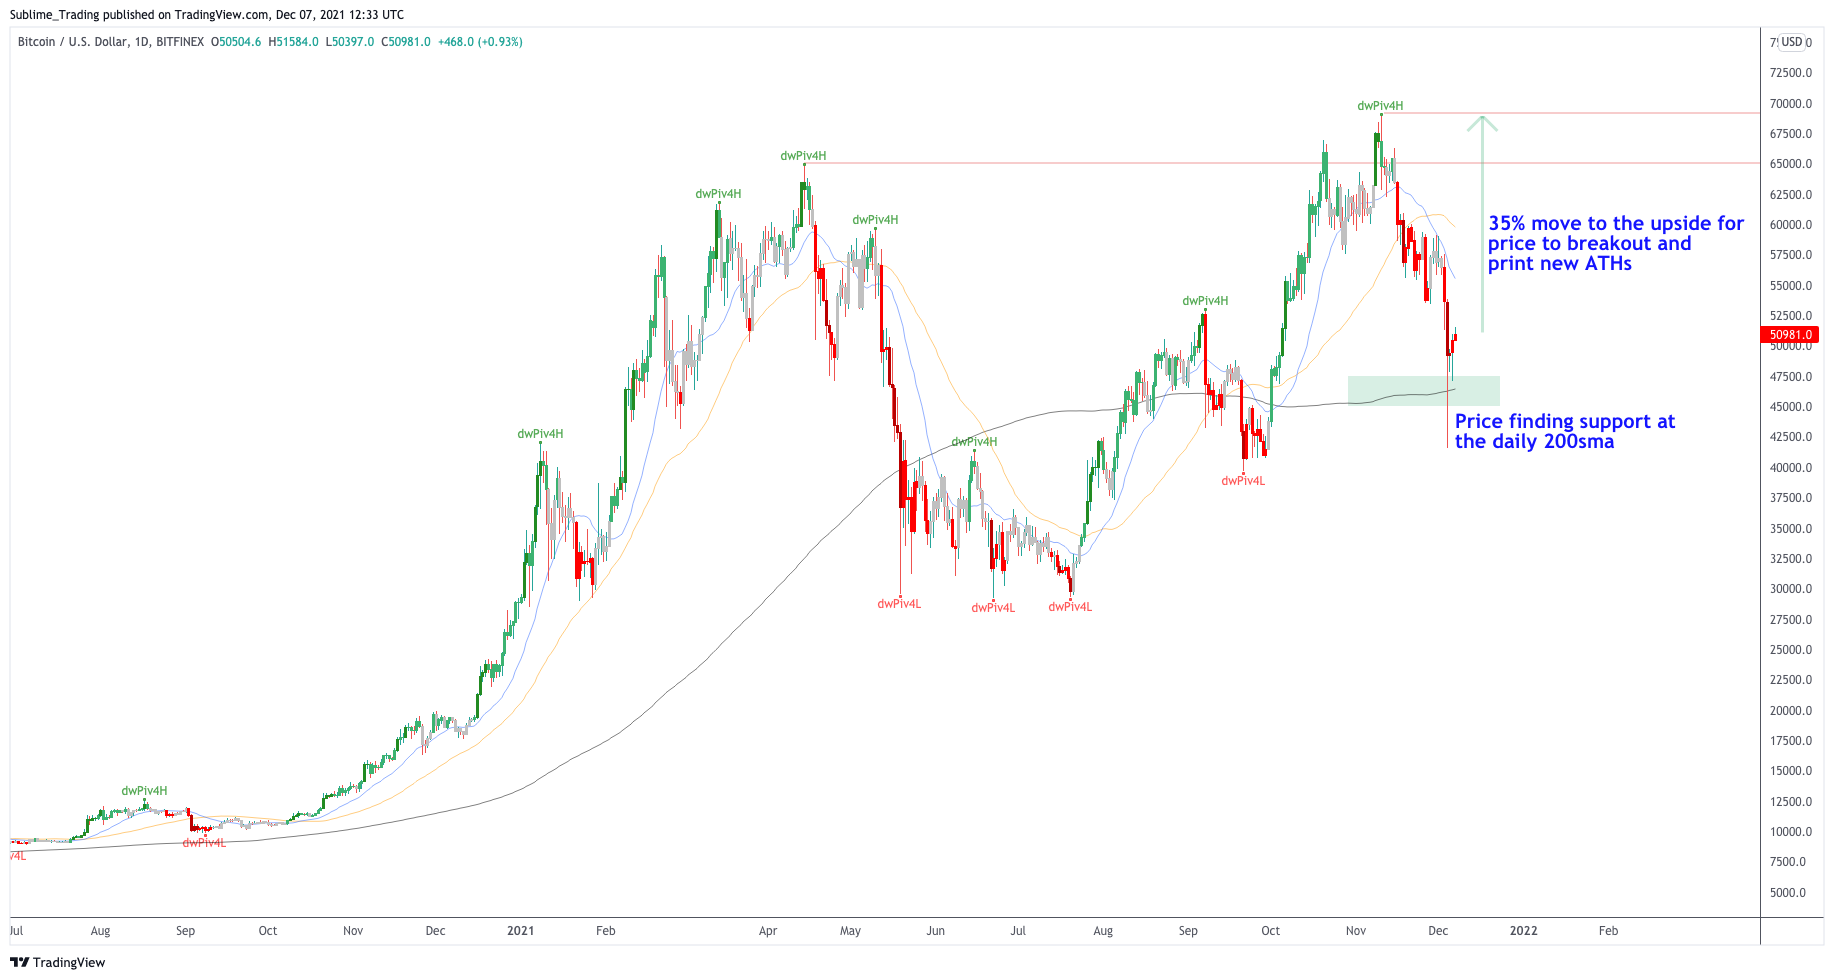
Below is the daily time frame for BTC. It is finding support at the daily 200sma, a key indicator of the long-term trend. If price remains above the daily 200sma, my bias remains bullish. Price, however, needs to do more work than ETH as price on BTC needs to move 35% to the upside before printing new ATHs.

Ethereum
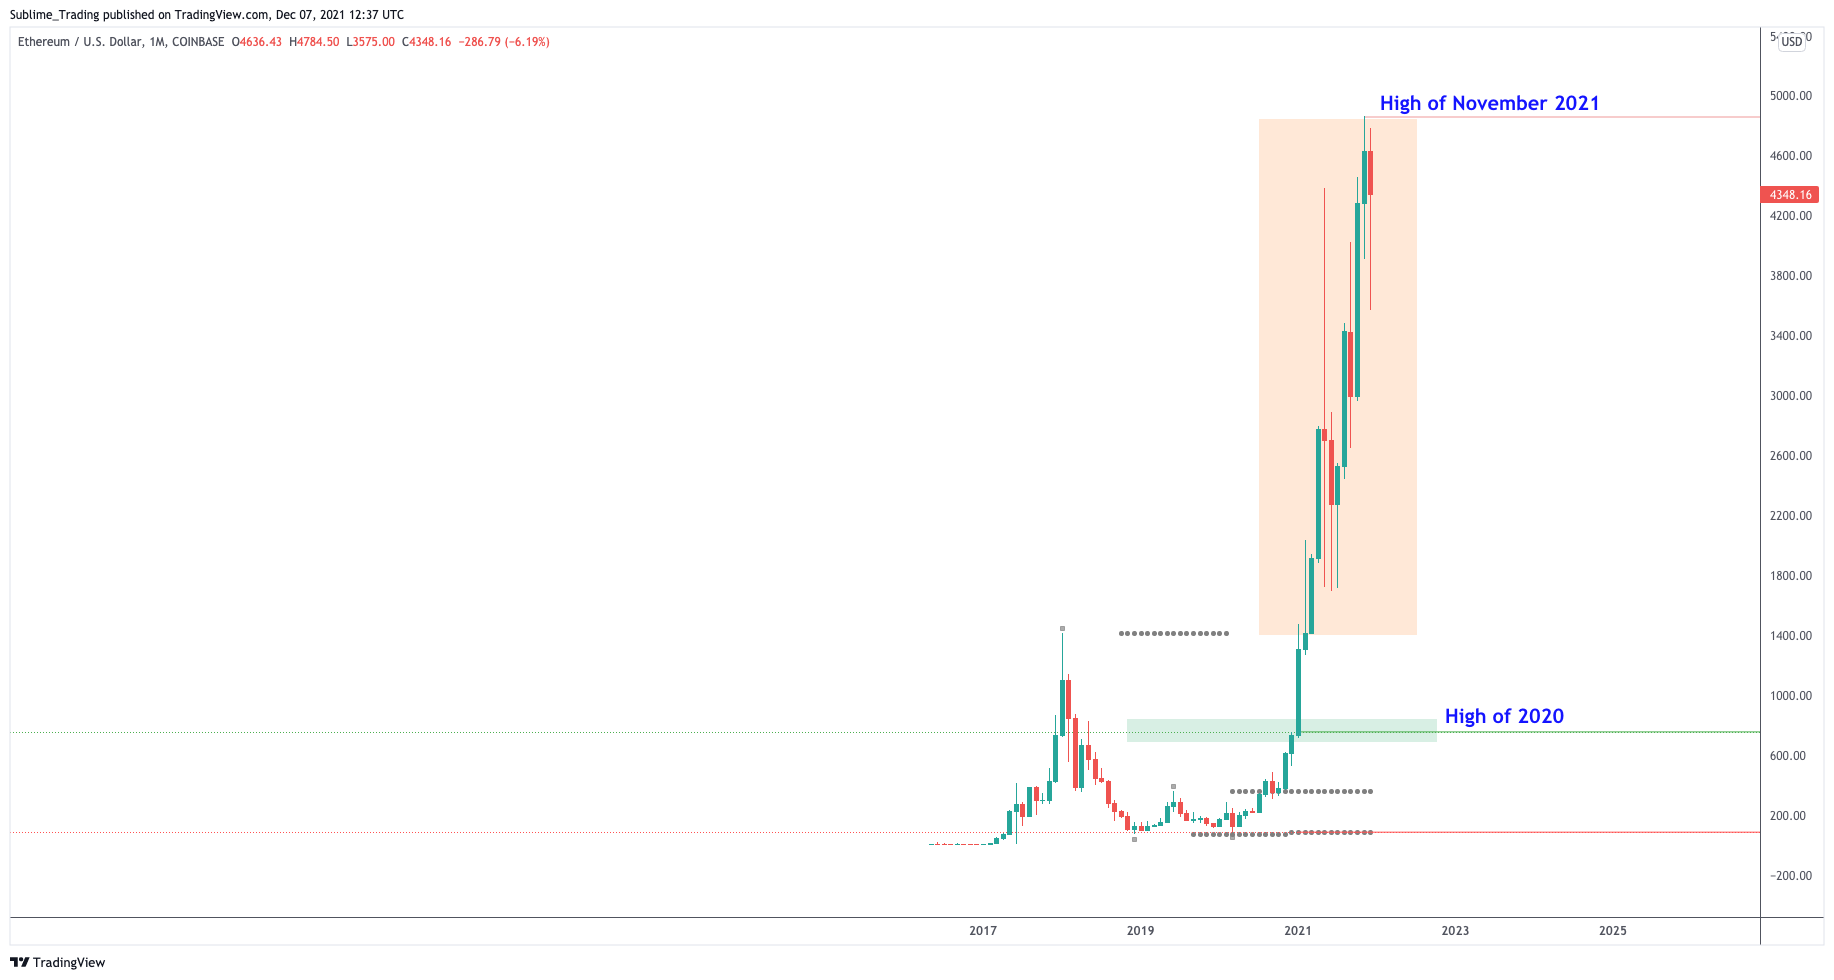
Starting with the monthly timeframe below and similar to BTC, ETH is also trading above the high of last year but below the ATH of May 2021.
Similarly to BTC, I view this as price having an overall bullish bias but currently trading inside a consolidation. This means I also favor a breakout to the upside.

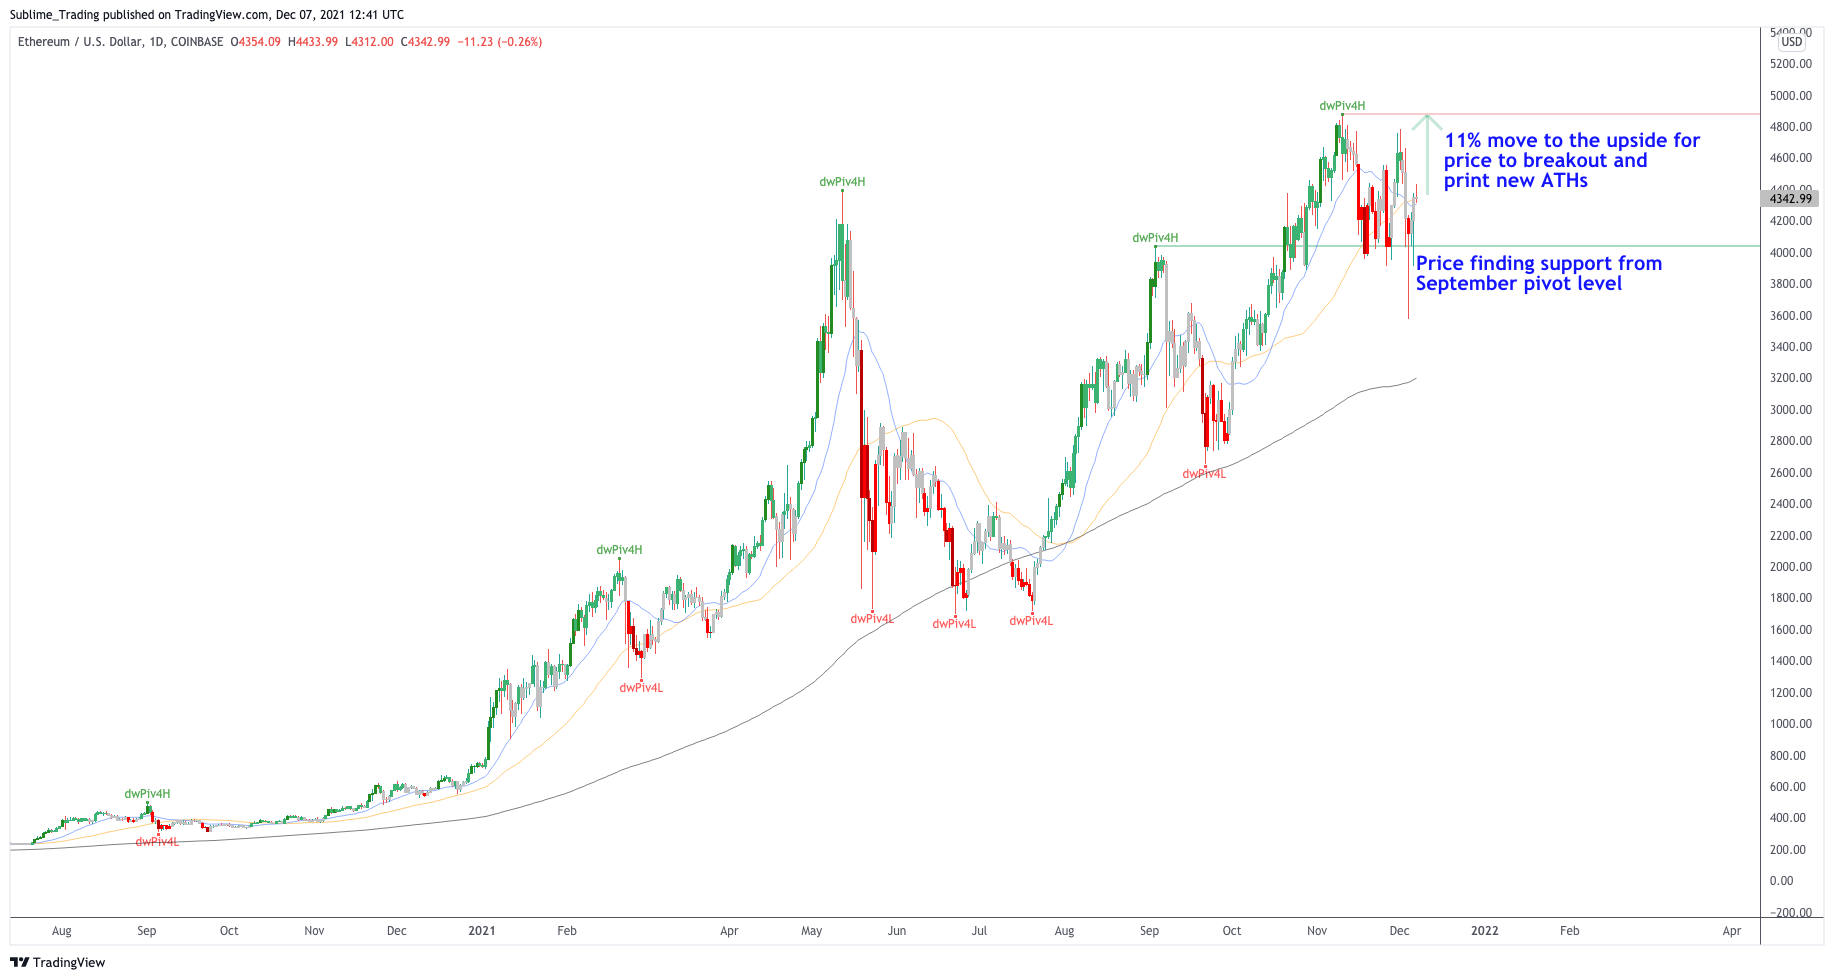
Below is the daily time frame for ETH. As mentioned above, price has far less work to do than BTC before it breaks out and pushes to new ATHs. ETH needs to move only circa 11% to print new ATHs compared to BTC's 35%. This is due to the support level from September 2021 holding strong.

You can see why some may consider ETH the better indicator.
For now, I continue to apply patience, monitor IDOs with potential and low-cap gems and add them to my crypto portfolio.
When BTC and ETH push to new ATHs, AltCoin season will follow, and when my exit management investor skills will be called upon, adapted to the crypto market.
© 2025 Benzinga.com. Benzinga does not provide investment advice. All rights reserved.
Trade confidently with insights and alerts from analyst ratings, free reports and breaking news that affects the stocks you care about.