
Square, Inc SQ is one of the 25 holdings on the new Roundhill MEME ETF MEME. The stock has been pressured downward recently due to the falling price of Bitcoin BTC/USD. The steep decline may also be related to Square’s Nov. 4 third-quarter earnings print, where the company reported its revenue from Bitcoin fell over 33% from the previous quarter.
- Square is trading in a consistent downtrend by making a series of lower lows and lower highs on the daily chat, with the most recent lower low printing on Dec. 6 at $170.75 and the most recent lower high created at the $195.28 mark on Wednesday.
- On Friday, the stock was looking to print a bearish Marubozu candlestick, which could indicate lower prices may come on Monday.
- On Dec. 6 when Square tested the $170 level as support, it ran into dip buyers and bounced up from the level. The level is a key support because the stock hasn’t traded below it since Nov. 4, 2020.
- Traders can watch for Square to potentially retest the key level as support and create a bullish double bottom pattern.
- The eight-day exponential moving average is another key level to watch as it has been pressuring the stock down since Oct. 29. Bullish traders may want to wait until Square closes a trading session above the eight-day before feeling confident a reversal may be in the cards.
- Square has resistance above at $182.24 and $192.21 and support below at $170.46 and near the $155 level.
Want direct analysis? Find me in the BZ Pro lounge! Click here for a free trial.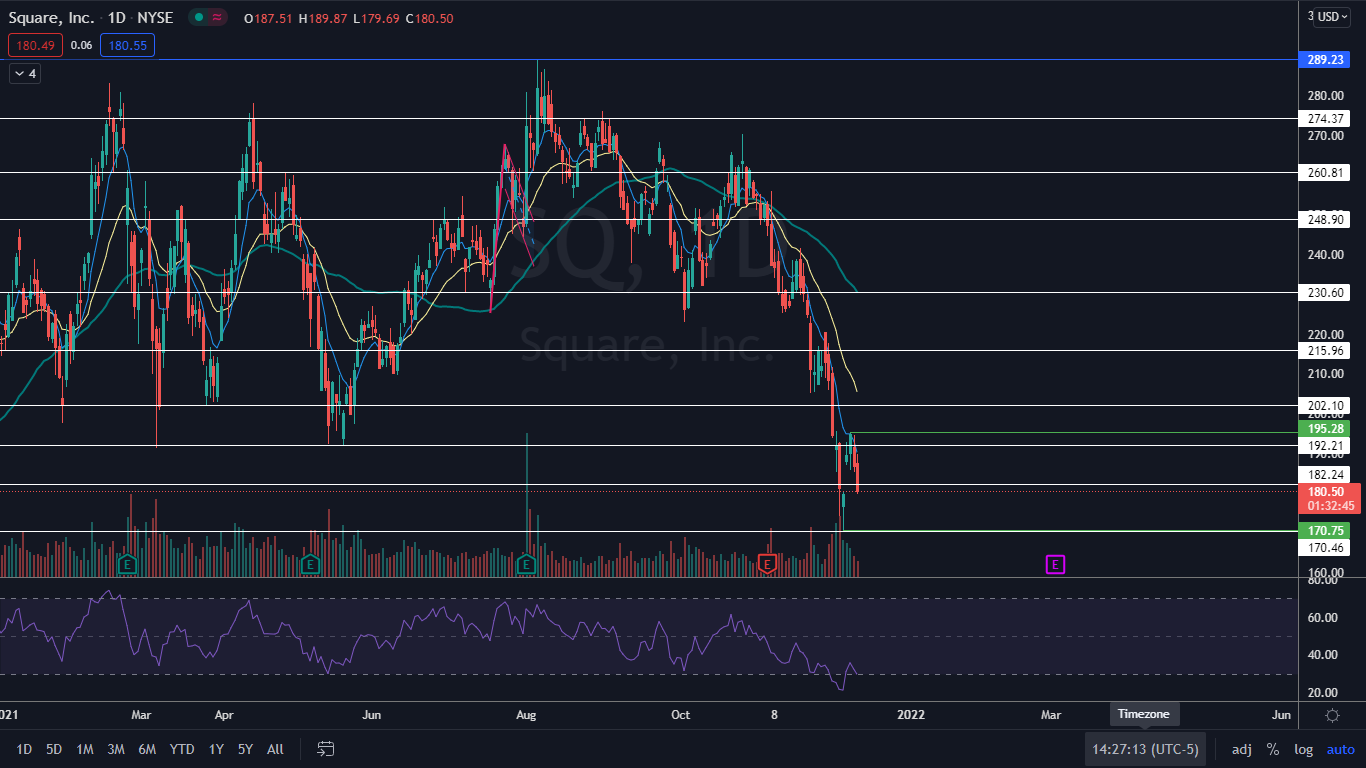
© 2025 Benzinga.com. Benzinga does not provide investment advice. All rights reserved.
Benzinga simplifies the market for smarter investing
Trade confidently with insights and alerts from analyst ratings, free reports and breaking news that affects the stocks you care about.
Join Now: Free!
Already a member?Sign in

