


Dogecoin DOGE/USD and Shiba Inu SHIB/USD have been trading in unison recently despite each cryptocurrency's enthusiasts remaining in fierce competition with each other.
Each of the crypto’s last seven candlesticks printed on the daily chart are almost identical and on Friday both Dogecoin and Shiba Inu both looked to be printing a reversal signal, albeit slightly differently. If the reversal candlesticks are recognized Dogecoin and Shiba Inu could be in for a trend change to the upside.
It should be noted that events affecting the direction of the general markets can quickly invalidate patterns, especially in the historically volatile crypto sector. As the saying goes, "the trend is your friend until it isn't" and any trader position should have a clear stop set in place and manage their risk versus reward.
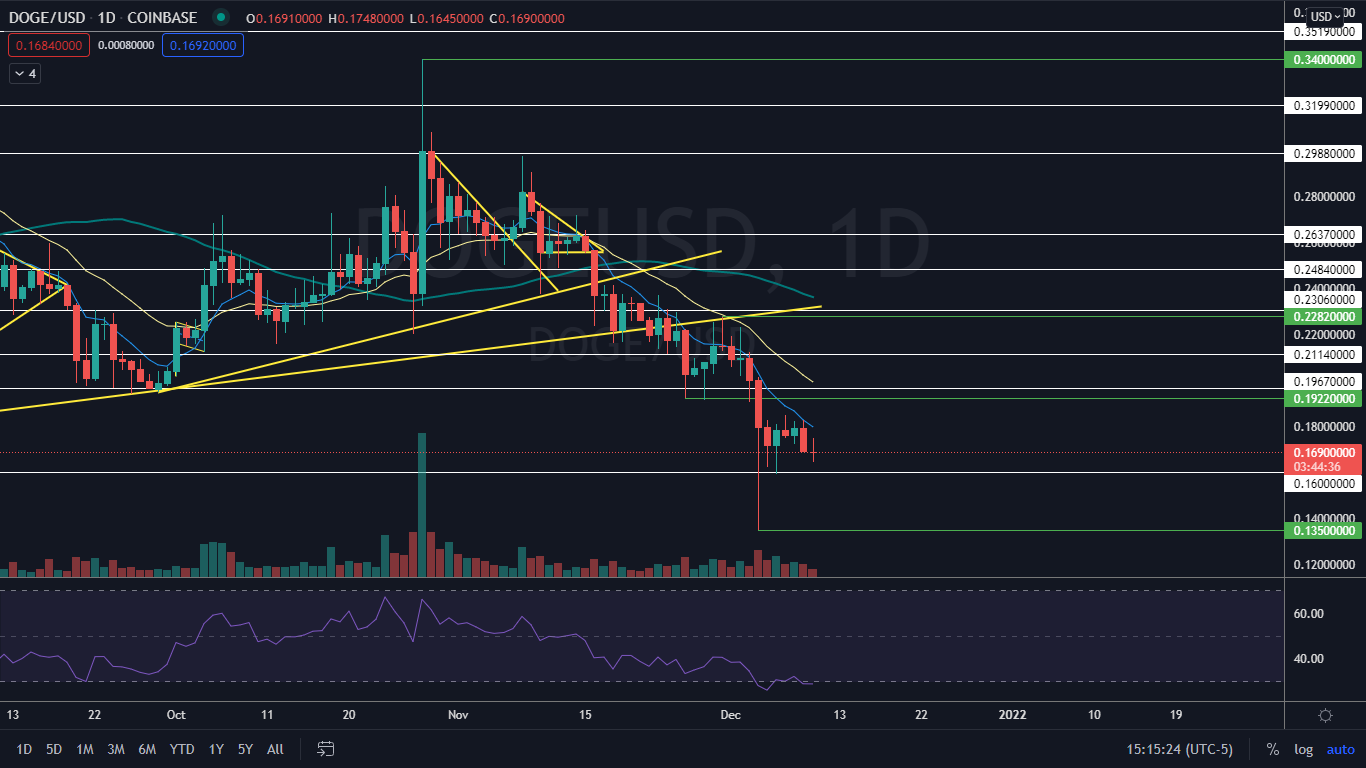
Both cryptos have spent the past six 24-hour trading sessions moving sideways across the left-hand side of the chart to consolidate the Dec. 4 crypto market flash crash when Bitcoin plummeted more than 20% before bouncing up slightly. The flash crash was slightly kinder to Shiba Inu, which fell about 27% on that date as compared to Dogecoin’s 32% slide.
The Dogecoin Chart: On Friday, Dogecoin was working to print a doji candlestick, which indicates the crypto may trade higher on Saturday.
- Dogecoin may be tightening into a pennant pattern on the daily chart and may begin making a series of lower highs and higher lows as its 24-hour trading range decreases.
- If the crypto continues to trade within the pattern, it will meet the apex on Dec. 13 and traders can watch for higher-than-average bullish or bearish volume to enter on the break of the pennant to gauge whether the formation has been recognized.
- Dogecoin has resistance above at 19 cents and the 21-cent level and key support below at 16 cents.
Want direct analysis? Find me in the BZ Pro lounge! Click here for a free trial.
The Shiba Inu Chart: Shiba Inu was working on printing an inverted hammer candlestick on Friday, which is often found at the bottom of a downtrend.
- Like Dogecoin, Shiba Inu may be tightening into a pennant formation but with the apex sitting at Dec. 12. Traders can also watch for higher-than-average volume to enter on a break of the pattern.
- Unlike Dogecoin, which has a relative strength index registering into oversold territory below the 30% level Shiba Inu’s RSI is sitting at about 40%, which could indicate the crypto has room to fall further.
- Shiba Inu has resistance above at $0.00003881 and $0.00004491 and support below at $0.00003209 and $0.00002801.
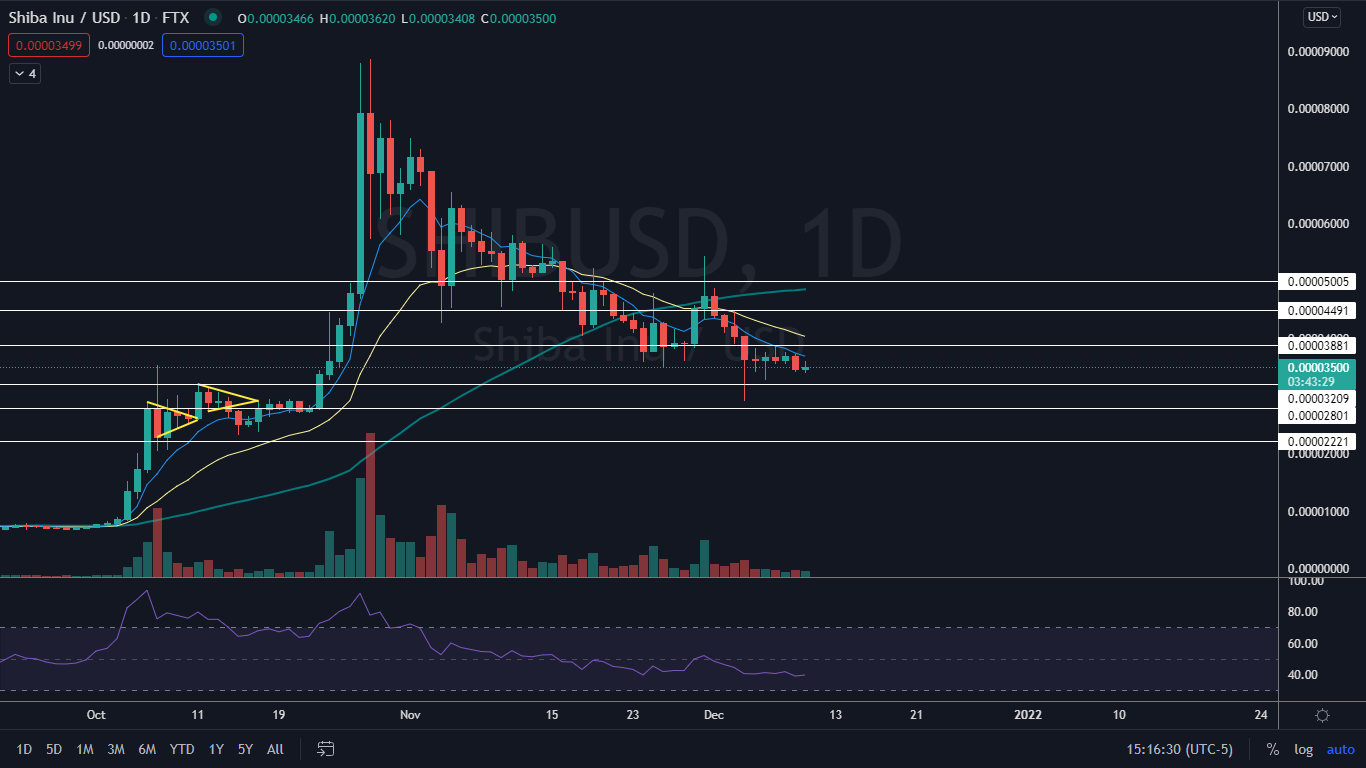
Image by Petra Göschel from Pixabay
Edge Rankings
Price Trend
© 2025 Benzinga.com. Benzinga does not provide investment advice. All rights reserved.
Trade confidently with insights and alerts from analyst ratings, free reports and breaking news that affects the stocks you care about.

