


Ethereum Classic ETH/USD was plummeting over 10% on Monday in sympathy with Bitcoin BTC/USD and Ethereum ETH/USD, which both suffered bearish breaks.
Technical traders may have seen the sell-off coming because on Dec. 8, Benzinga pointed out the bear flag pattern Ethereum Classic had printed on the daily chart, which the crypto reacted bearishly to the following day. While Bitcoin and Ethereum traded to new all-time highs in November, Ethereum Classic has failed to make it anywhere close to its May 6 all-time high of $175 and on Monday the crypto looked to be headed toward a do-or-die level of $32.17.
See Also: How to Buy Ethereum Classic
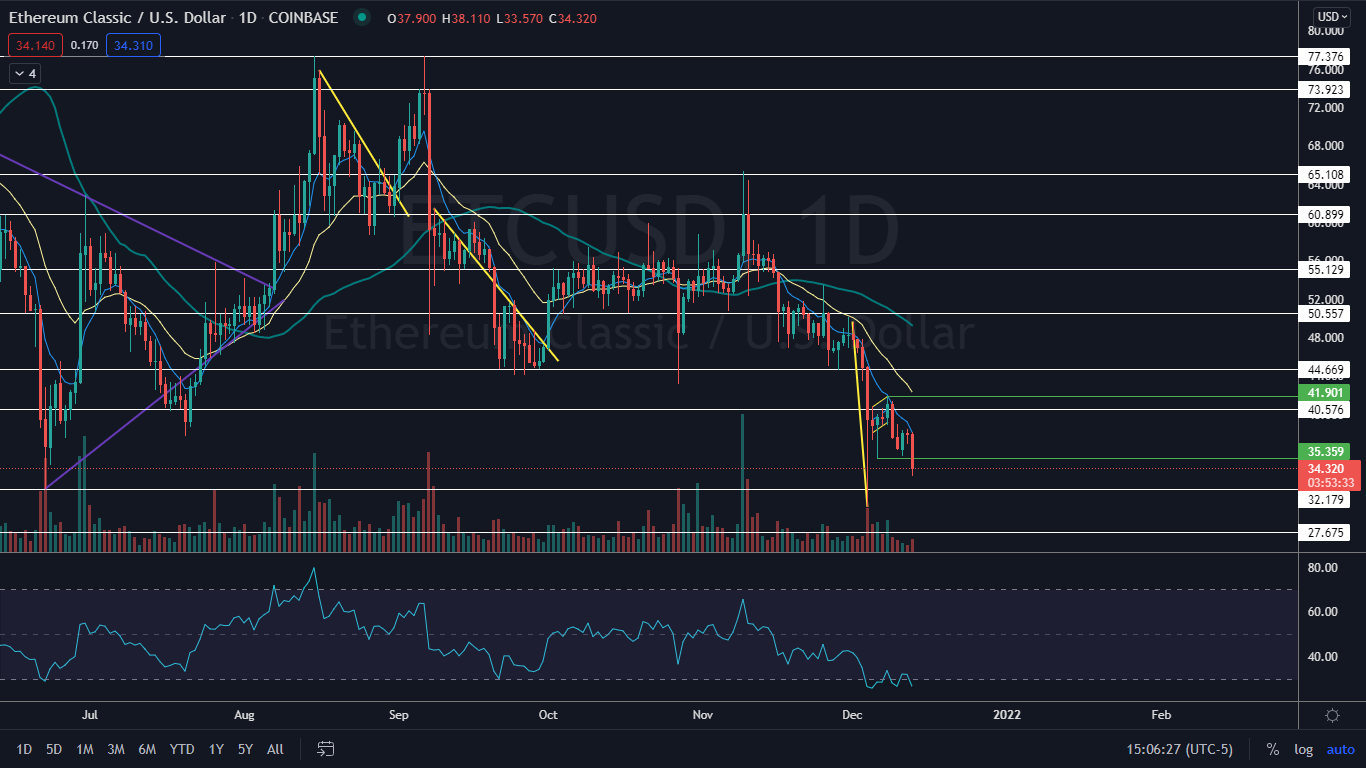
The Ethereum Classic Chart: Ethereum Classic has not traded below the $32 level since April 26 and has bounced from that price two previous times, on June 22 and on Dec. 4 when the crypto market experienced a flash crash. If Ethereum Classic falls below that area, it is likely to act as heavy resistance.
The crypto has been trading in a solid downtrend since Nov. 9, when it reached a high of $65.33. Since that date it has made a consistent series of lower highs and lower lows on the daily chart, with the most recent lower high printed on Dec. 8 at $41.90 and the most recent lower low created on Monday when Ethereum Classic fell below the Dec. 6 low-of-day at the $35.35 mark.
Ethereum Classic is likely to eventually bounce up, at least to create another lower high, because the crypto’s relative strength index (RSI) is registering in low at the 27% level. When a stock or crypto’s RSI reaches or fall below the 30% level, it becomes oversold, which can be a buy signal for technical traders.
On Monday, Ethereum Classic was working on printing a bearish Marubozu candlestick, which indicates lower prices may come on Tuesday. If lower prices don’t immediately follow, Ethereum Classic is likely to print an inside bar pattern to consolidate the move lower.
Ethereum Classic is trading below the eight-day and 21-day exponential moving averages (EMAs), with the eight-day EMA trending below the 21-day, both of which are bearish indicators. The crypto is also trading below the 50-day simple moving average, which indicates longer-term sentiment is bearish.
Want direct analysis? Find me in the BZ Pro lounge! Click here for a free trial.
- Bulls want to see Ethereum Classic hold above the key $32 level, consolidate sideways on low volume, and then for big bullish volume to come in and push the crypto up to make a higher high. There is resistance above at $40.57 and $44.66.
- Bears want to see big bearish volume come in and drop the crypto below the key level, which could indicate bullish traders and investors have lost interest in the crypto. Below the $32 area, Ethereum Classic has support at $27.67 and $20.45.
Relate Link: If You Had $1,000 Right Now, Would You Buy The Dip In Ethereum Classic, Shiba Inu, Litecoin Or Dogecoin?
Edge Rankings
Price Trend
© 2025 Benzinga.com. Benzinga does not provide investment advice. All rights reserved.
Trade confidently with insights and alerts from analyst ratings, free reports and breaking news that affects the stocks you care about.

