


After trending downward for the past month, Coinbase Global, Inc COIN was bouncing almost 2% higher on Tuesday, partly propelled by Bitcoin BTC/USD, which was trading slightly higher in an inside bar consolidation pattern.
Stocks with close ties to the cryptocurrency market have been particularly hard hit in recent sessions, due to Bitcoin and Ethereum ETH/USD retracing significantly at the same time as the general markets pull back.
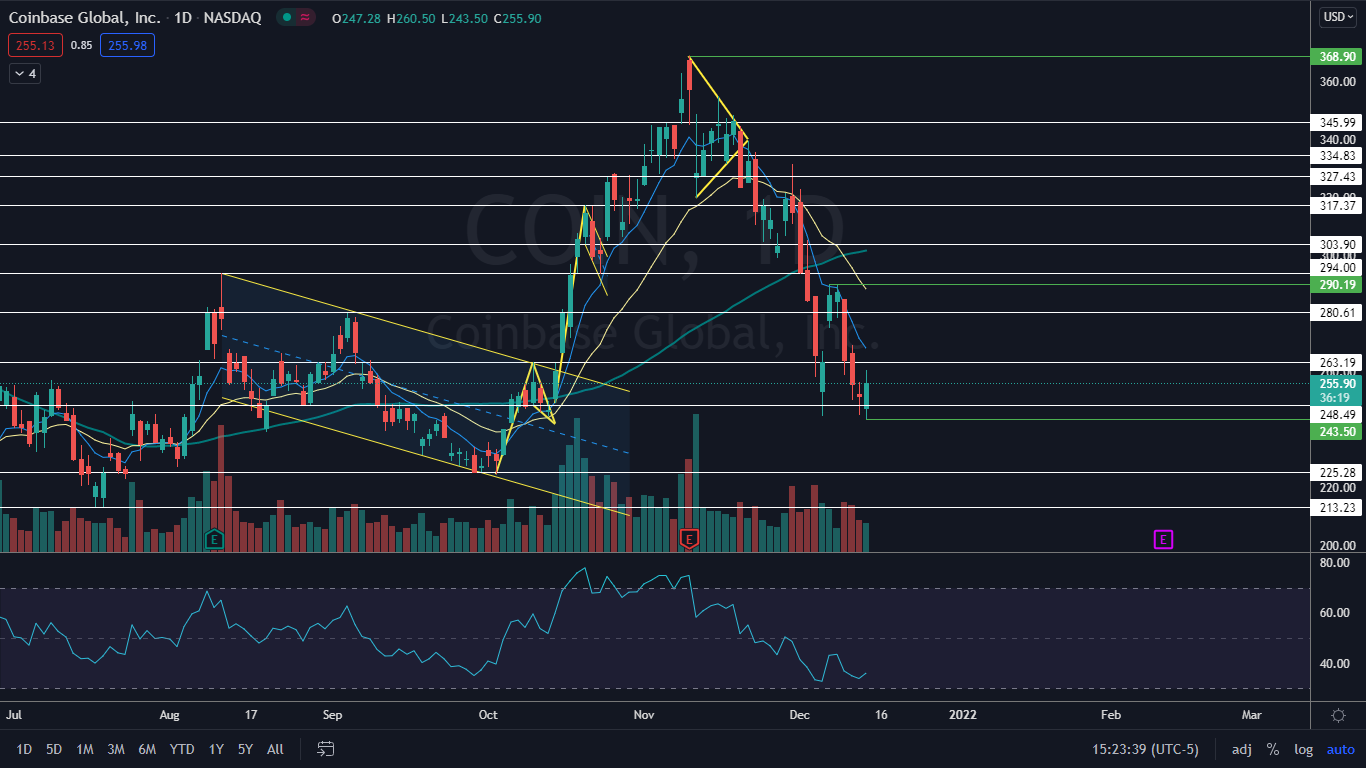
The cryptocurrency exchange platform has fallen 34% since reaching a Nov. 9 high of $368.90 and if Bitcoin and Ethereum don’t reverse course soon, the sell-off for Coinbase could continue.
See Also: Markets Suggest Further Selloff Of Cathie Wood's ARK Innovation ETF Coming
The Coinbase Chart: On Tuesday, Coinbase was trading slightly higher to relieve its relative strength index (RSI), which on Monday was nearing oversold territory at about 33%. When the stock’s RSI hit the same level on Dec. 6, Coinbase bounced about 18% higher over the following two trading days, which allowed it to print a lower high at the $290 level.
Coinbase retested the area as resistance Dec. 7 and it was rejected, creating a bearish double top pattern on the daily chart. The stock then reacted to the pattern and sold off 16% to reach a lower low at the $243.50 level on Tuesday.
Tuesday’s relief bounce occurred on lower-than-average volume, which indicates there is currently a lack of interest in the stock from a bullish perspective. By late afternoon, only 2.97 million shares had exchanged hands, compared to the 10-day average of 4.97 million.
Technical traders may have seen the bounce coming because on Monday Coinbase printed a doji candlestick, which when found at the bottom of a trend can indicate a reversal. Because Tuesday’s candle is a bullish engulfing candlestick, it indicates a large move to the upside may come on Wednesday, though that may just be to print another lower high.
Coinbase is trading below the eight-day and 21-day exponential moving averages (EMAs), with the eight-day EMA trending below the 21-day, both of which are bearish indicators. The stock is also trading below the 50-day simple moving average, which indicates longer-term sentiment is bearish.
Want direct analysis? Find me in the BZ Pro lounge! Click here for a free trial.
- Bulls want to see big bullish volume come in and push Coinbase up over a resistance level at $263.19 or for the stock to consolidate sideways and hold above the $245.50 level, which could negate the downtrend. Above $263 there is further resistance near $280 and $294.
- Bears want to see big bearish volume come in and drop Coinbase down to print another lower low to confirm the downtrend is not over. There is support below at $248.49 and $225.48.
Coinbase closed up 1.79% on Tuesday at 255.86.
Related Link: Coinbase Set To Launch NFT Support Via Self-Custody Wallet
Photo: Courtesy of coinbase.com/press
Edge Rankings
Price Trend
© 2025 Benzinga.com. Benzinga does not provide investment advice. All rights reserved.
Trade confidently with insights and alerts from analyst ratings, free reports and breaking news that affects the stocks you care about.

