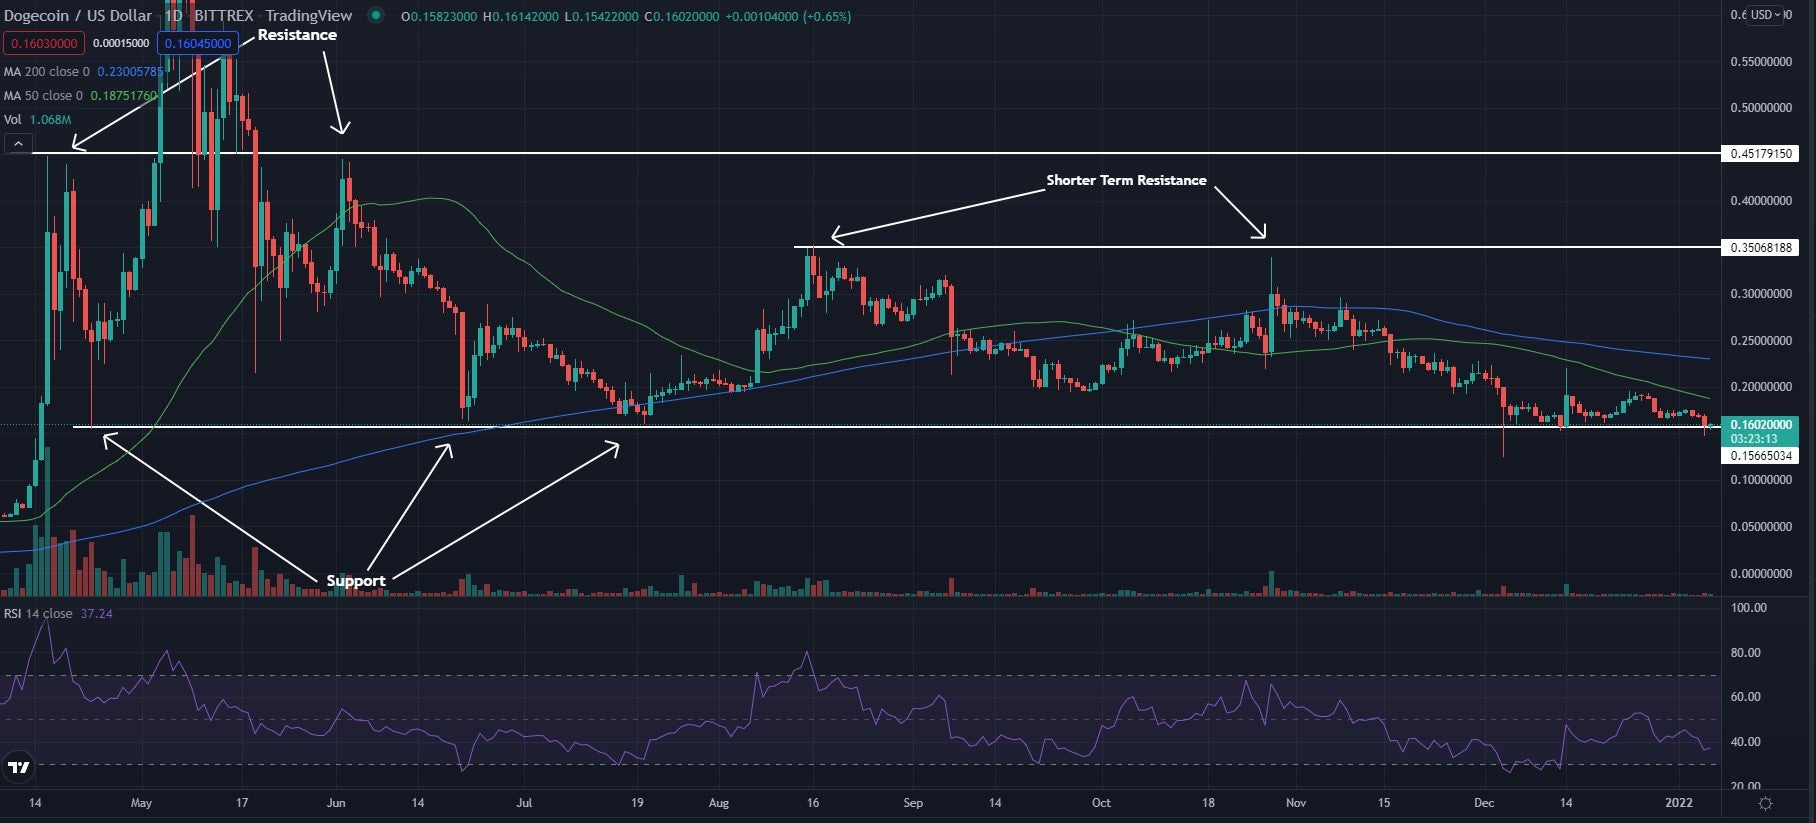
Dogecoin DOGE/USD shares are trading slightly higher Thursday as most of the crypto market is seeing a red day. Dogecoin is nearing a key time on the chart as it sits right on top of an important support line.
Dogecoin was up 0.44% at $0.1605 Thursday afternoon at publication.
See Related: Dogecoin Bites At Bullish Enthusiasts As The Crypto Falls Through Key Level: What's Next?
Dogecoin Daily Chart Analysis
- Dogecoin has been trending lower throughout the past couple of months and now sits just above the $0.15 support level in a sideways channel. The crypto is showing resistance near the $0.35 level, as it has been a place where the price has struggled to cross above.
- The crypto trades below both the 50-day moving average (green) and the 200-day moving average (blue). This shows the crypto is trading with bearish sentiment and each of these moving averages may hold as an area of resistance in the future.
- The Relative Strength Index (RSI) has been trading sideways below the middle line for the past couple of months and sits at 37. This shows that sellers are outweighing the buyers in the crypto, and if the RSI drops below 30 the price could see a strong bearish push. If the RSI climbs above the middle line the price may start to head back up once again.

What’s Next For Dogecoin?
Dogecoin is in a key area of the chart where it will either see a bounce off support or it will see a strong bearish move and break below support. If the crypto can begin to form higher lows it may be a bullish sign that a run may be coming, while holding the $0.15 level as resistance could be a bearish sign. Bulls are looking for the break over the moving averages, while bears are looking for the break below the $0.15 support level.
© 2025 Benzinga.com. Benzinga does not provide investment advice. All rights reserved.
Trade confidently with insights and alerts from analyst ratings, free reports and breaking news that affects the stocks you care about.