Coinbase Global Inc COIN and Robinhood Markets Inc HOOD have been in long-term downtrends but have recently printed possible reversal signals on their daily charts.
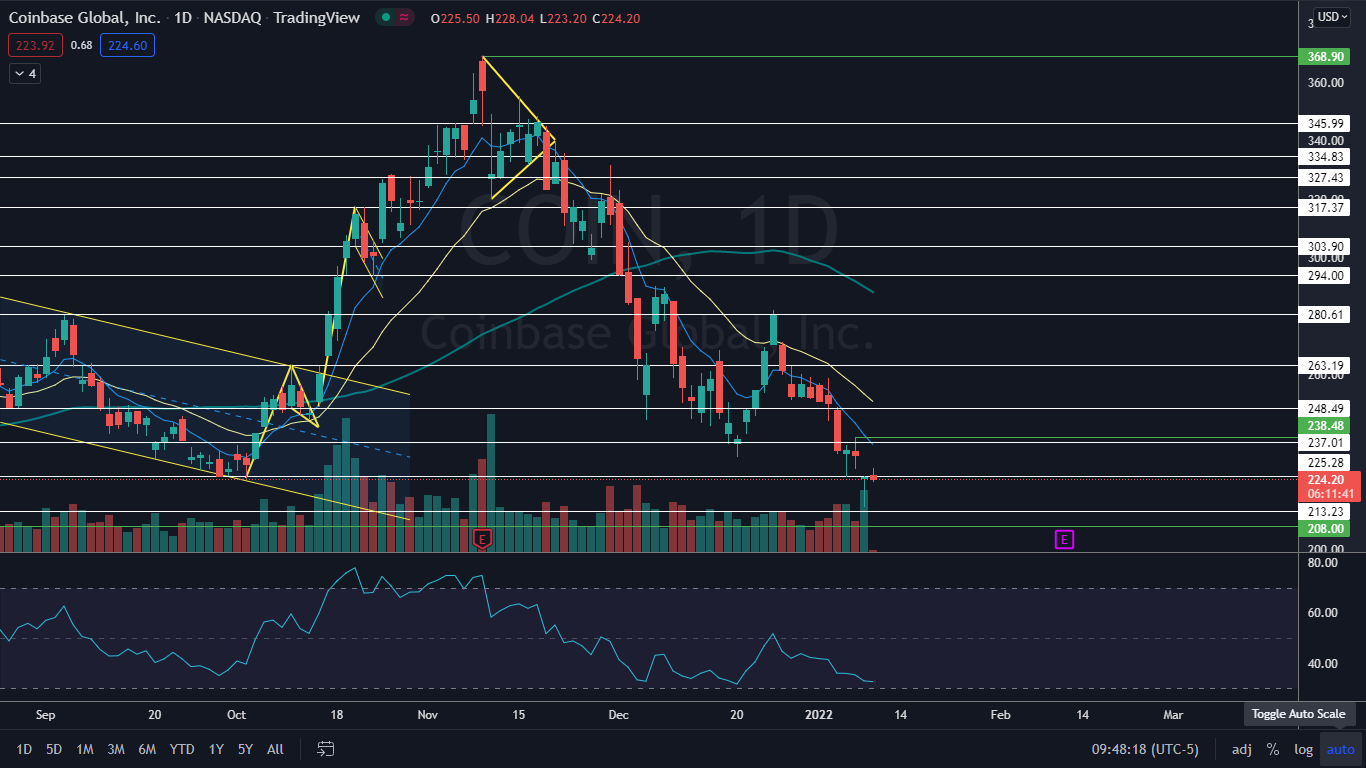
On Monday, Coinbase bounced up from near to a support level and printed a dragonfly doji candlestick on the daily chart, which indicates high prices may come on Tuesday.
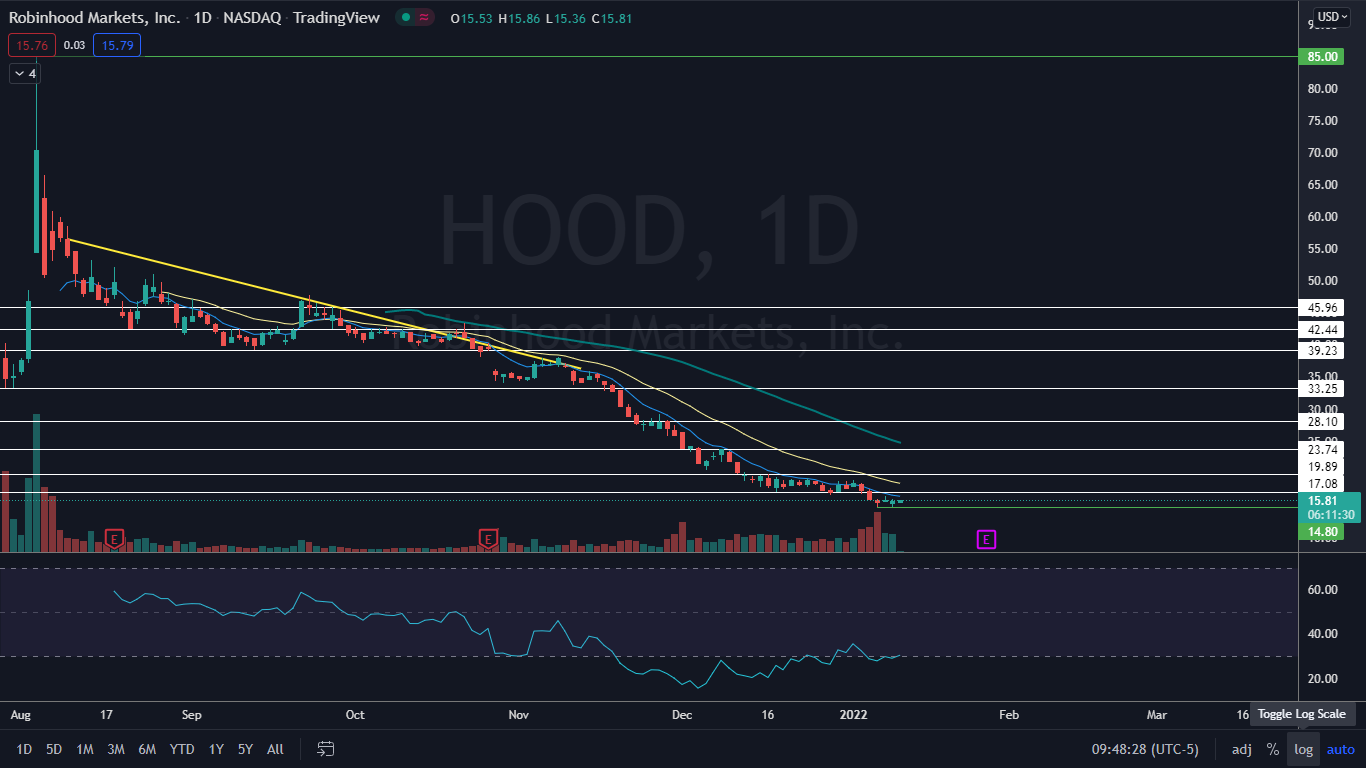
Robinhood tested the new all-time low it printed on Jan. 6 and bounced up to print a doji candlestick. The backtest and bounce up from the level also created a bullish double bottom pattern.
Although both stocks have a lot of work to do to give bulls confidence, a reversal may be in the cards and there are signs the bottom may be in for Coinbase and Robinhood.
It should be noted that events such as the general markets turning bearish, negative reactions to earnings prints and negative news headlines about a stock can quickly invalidate bullish patterns and breakouts.
As the saying goes, "the trend is your friend until it isn’t," and any trader in a bullish position should have a clear stop set in place and manage their risk versus reward.
Want direct analysis? Find me in the BZ Pro lounge! Click here for a free trial.
In The News: On Monday, Cathie Wood's Ark Investment Management continued to load shares of both Coinbase and Robinhood. The money management firm added 319,961 shares of Robinhood to its existing 22.2 million share position and purchased 143,518 more shares of Coinbase, which adds to the stake of 4.87 million shares the firm held prior to Monday.
Ark Investment has been using the dips in Bitcoin and the wider cryptocurrency market to add to positions of stocks that have exposure to the crypto space.
The Coinbase Chart: On Monday, Coinbase came within about just $6 of its May 19 low of $208 but bounced up from a support level near $213.23 to close on a support level at $225 and printed a dragonfly candlestick.
- The candlestick was printed on higher-than-average volume, which indicates the bulls are fighting for control. On Monday, more than 6 million shares of Coinbase exchanged hands compared to the 10-day average of 4.06 million.
- When the market opened Tuesday, Coinbase was attempting to react bullishly to the dragonfly doji candlestick.
- Coinbase has a lot of work to do to convince conservative traders the bottom is in because the stock will need to print a high followed by a higher low above Monday’s low-of-day to indicate a trend change is taking place.
- Coinbase has resistance above at $225.28 and $237.01 and support below at $213.23 and the all-time low.

The Robinhood Chart: On Thursday and Monday, Robinhood printed a double bottom pattern at the all-time low of $14.75 and on Tuesday, Robinhood was trading up slightly higher in an attempt to react bullishly to the formation.
- Robinhood’s relative strength index (RSI) has been mostly registering in at lower than 30% since Nov. 18. When a stock’s RSI reaches or exceeds the 30% level it becomes oversold, which can be a buy signal for technical traders. It should be noted that RSI levels can remain extended for long periods of time.
- Bullish traders can watch for consistent higher than average bullish volume to indicate sentiment has changed in Robinhood’s stock.
- Like Coinbase, in order to buck the downtrend, Robinhood will need to print a high followed by a higher low.
- Robinhood has resistance above at $17.08 and $19.89 and support below at its all-time low.

Photos: Courtesy Coinbase, Robinhood
Edge Rankings
Price Trend
© 2025 Benzinga.com. Benzinga does not provide investment advice. All rights reserved.
Trade confidently with insights and alerts from analyst ratings, free reports and breaking news that affects the stocks you care about.