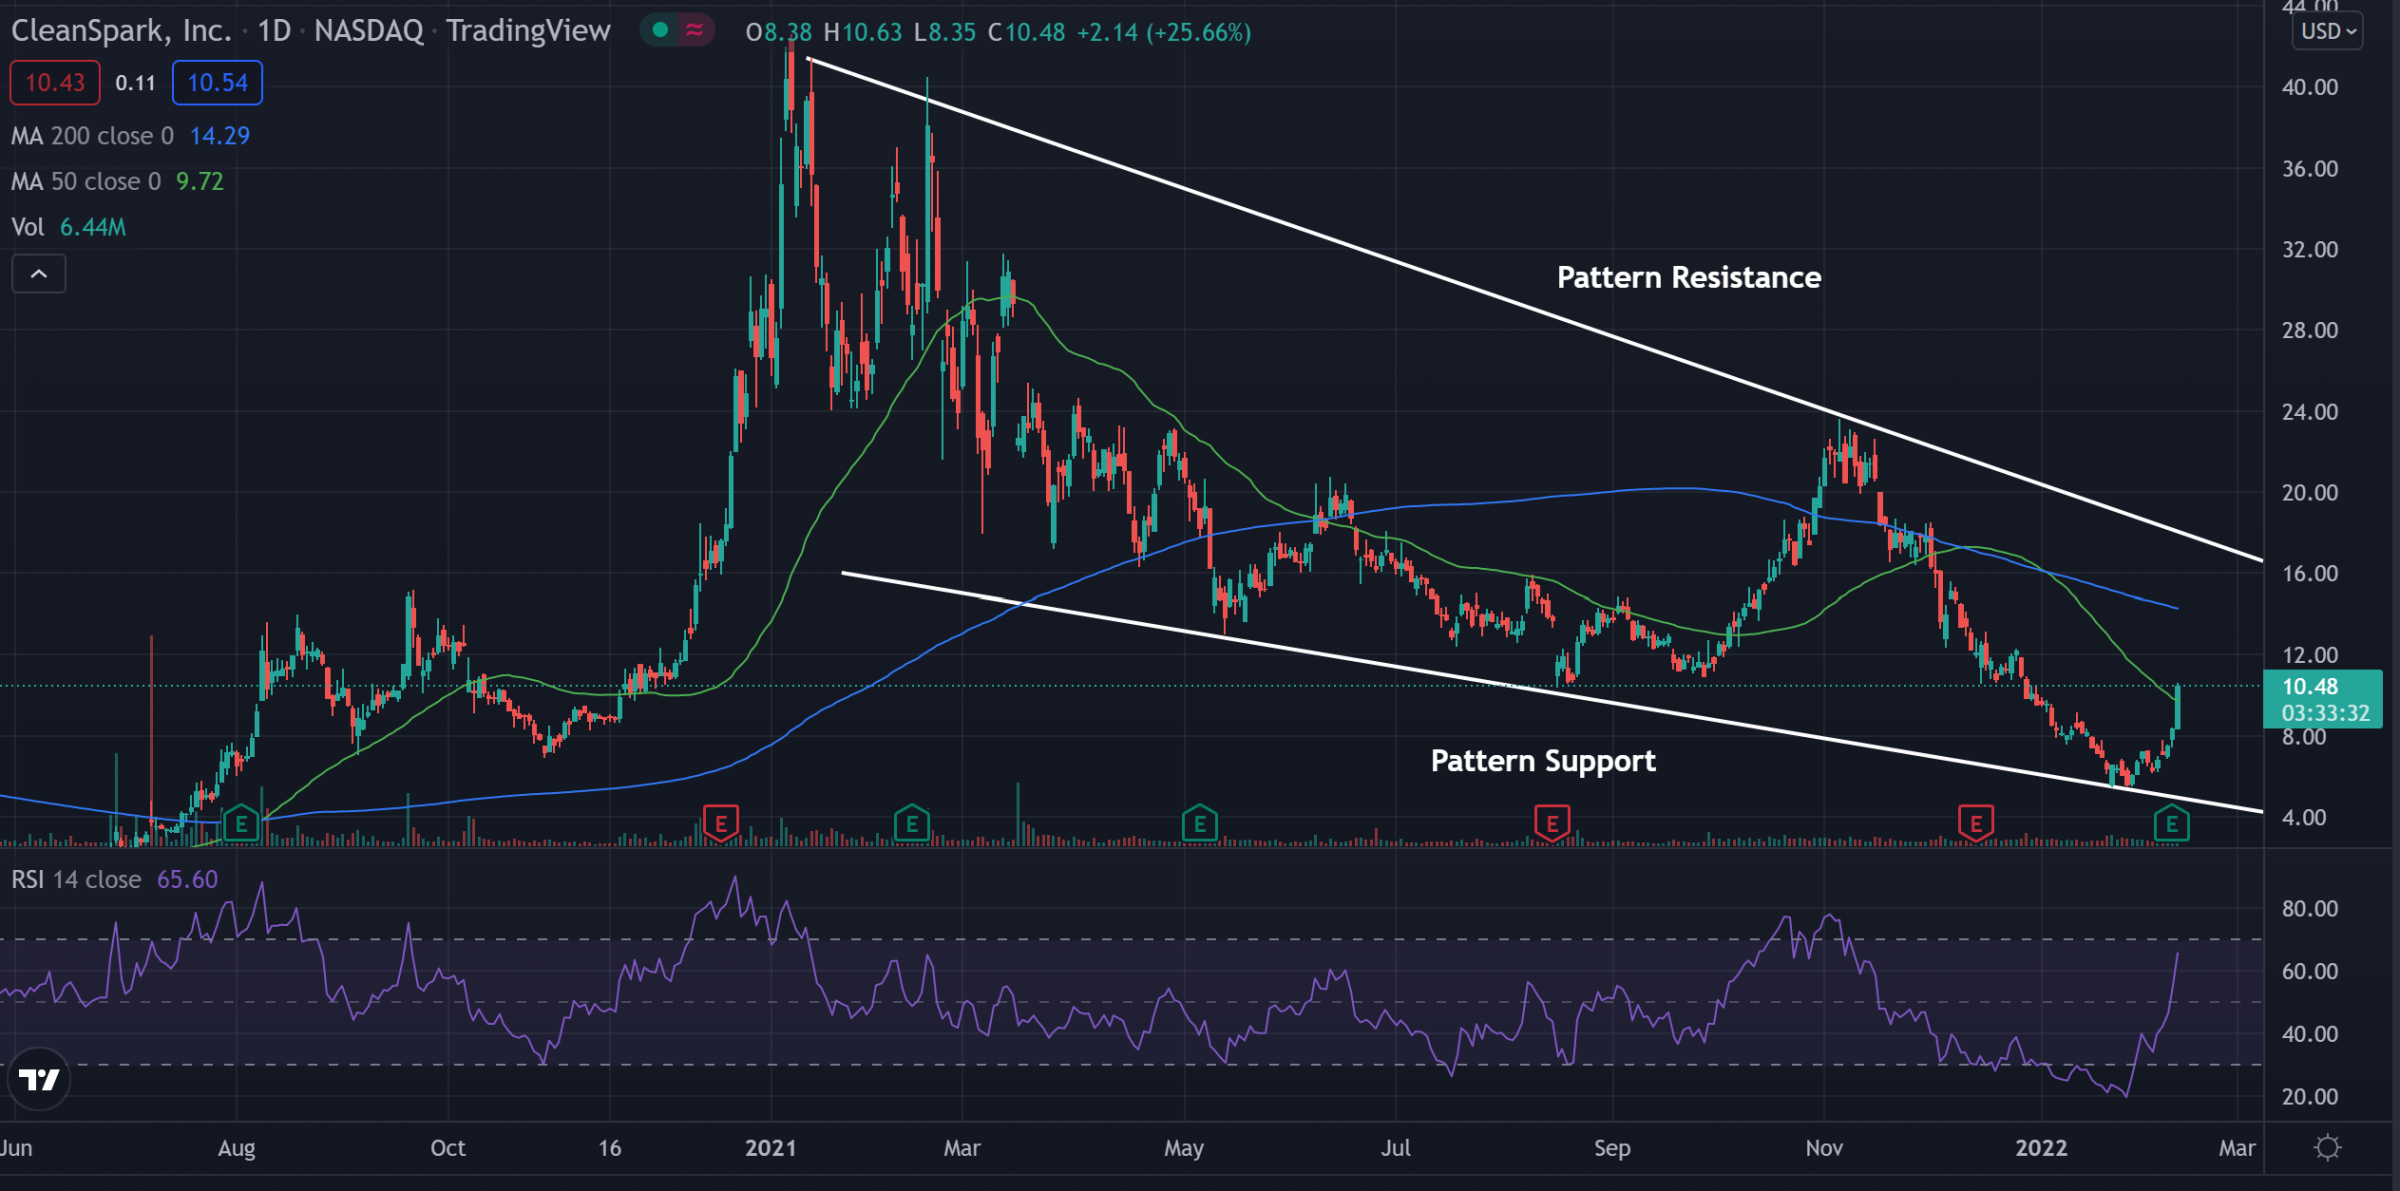
Cleanspark Inc. CLSK shares were trading higher Thursday after the company reported first-quarter earnings results. Earnings per share came in at 36 cents, missing the 37 cent per share analyst estimate. Sales were reported to be $41.24 million, missing the $41.35-million estimate.
Cleanspark was up 14.87% at $9.58 Thursday afternoon.
Cleanspark Daily Chart Analysis
- The stock recently saw a bounce off support in what traders call a falling wedge pattern. The pattern occurs when the stock is making lower lows and lower highs, but the highs fall at a steeper slope. The pattern is known as a bullish reversal pattern if the stock can cross above the resistance level and consolidate.
- The stock crossed above the 50-day moving average (green) Thursday, but trades below the 200-day moving average (blue). This indicates the stock is beginning to see some consolidation. The 50-day moving average may hold as an area of support, while the 200-day moving average may act as resistance.
- The Relative Strength Index (RSI) has been climbing for the last couple of weeks and now sits at 65. The RSI crossing above the middle line shows that the stock is seeing more buying pressure now than selling pressure.
- If the RSI can continue to climb, it may reach the overbought area, where it will see many more buyers than sellers.

What’s Next For Cleanspark?
Cleanspark is seeing some bullish momentum after reporting earnings. If the bullish momentum can continue the stock could eventually see a reversal. For the reversal to happen bullish traders are looking to see the stock start to form higher lows and then be able to cross above resistance. Bearish traders want to see the stock be unable to break above resistance and want to see the stock fall below the support level for a possible further downward move.
© 2025 Benzinga.com. Benzinga does not provide investment advice. All rights reserved.
Trade confidently with insights and alerts from analyst ratings, free reports and breaking news that affects the stocks you care about.