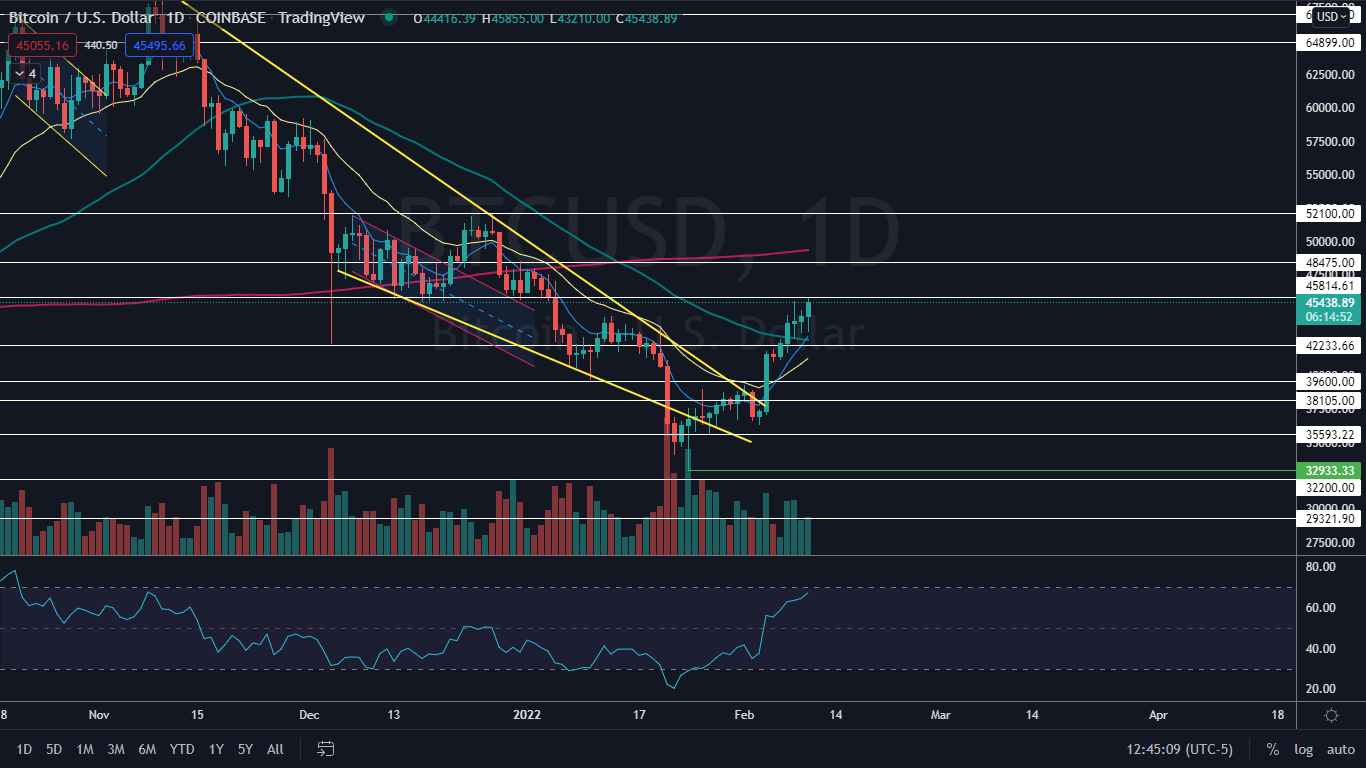
Bitcoin BTC/USD was trading almost 3% higher on Thursday as it attempted to bust up through a resistance area at the $45,814.61 level.
The cryptocurrency market has been on an upswing in recent weeks after apex cryptos Bitcoin and Ethereum ETH/USD hit bottom on Jan. 24 at the $32,933.33 and $2,159 mark, respectively.
The current trend looks set to continue especially if Bitcoin can rise up over the $49,000 level where the 200-day simple moving average is currently trending. If the crypto can regain the level as support, the 50-day SMA will eventually cross above the 200-day, which would create a bullish golden cross.
See Also: Will Bitcoin Face Resistance And Ethereum Touch $4K? Here's What The Experts Are Saying
The Bitcoin Chart: Bitcoin is trading in a confirmed uptrend with the most recent higher low printed on Feb. 3 near the $36,400 level and the most recent higher high forming on Thursday. Eventually, the crypto will need to print another higher low, which could provide traders not already in a position with a solid entry with a stop at the Feb. 3 low-of-day.
- The higher low is likely to take place over the coming days because Bitcoin’s relative strength index (RSI) is registering at about the 69% level. When a stock or crypto’s RSI reaches or exceeds 70% it becomes overbought, which can be a sell signal for technical traders.
- Traders and investors can watch for lower-than-average volume on the next lower high to feel confident the uptrend will remain intact.
- Bitcoin has resistance above at $48,475 an $52,100 and support below at $42,233.66 and $39,600.
Want direct analysis? Find me in the BZ Pro lounge! Click here for a free trial.
© 2024 Benzinga.com. Benzinga does not provide investment advice. All rights reserved.
Trade confidently with insights and alerts from analyst ratings, free reports and breaking news that affects the stocks you care about.