Zinger Key Points
- Despite its rise on Tuesday, Ethereum Classic is still trading down about 85% from its May 6, 2021 52-week high of $175.
- Ethereum Classic is trading below the eight-day and 21-day exponential moving averages, which is a bearish indicator.
- Don't face extreme market conditions unprepared. Get the professional edge with Benzinga Pro's exclusive alerts, news advantage, and volatility tools at 60% off today.
Ethereum Classic ETC/USD was outperforming the apex cryptocurrencies on Tuesday, flying up 8.38% higher at one point, compared to Bitcoin BTC/USD and Ethereum ETH/USD, which were trading up about 3.6% and 3.5%, respectively, when they reached their high-of-day.
The cryptocurrency sector as a whole detached from the general markets on Tuesday, rising up higher in contrast to the SPDR S&P 500 SPY which was falling over 1.5%. The crypto sector had been trading in tandem with the general markets recently, reacting bearishly to a noticeably more hawkish tone coming from the Federal Reserve as it attempts to combat rising inflation.
Some traders and investors may be turning to crypto as a safe-haven asset as the likelihood of a full-scale Russian invasion of Ukraine looks increasingly imminent. The price of gold, another widely recognized safe-haven asset during times of economic and political uncertainty, has been on a tear recently, rising 7.51% higher since Jan. 28, reaching above the $1,900 mark.
Ethereum Classic has a lot of work to do to prove its downtrend is over, however, and despite its rise on Tuesday, the crypto is still trading down about 85% from its May 6, 2021 52-week high of $175.
See Also: Russian Financial Markets Collapse, US Futures Plummet Over Fears Of Ukraine Invasion
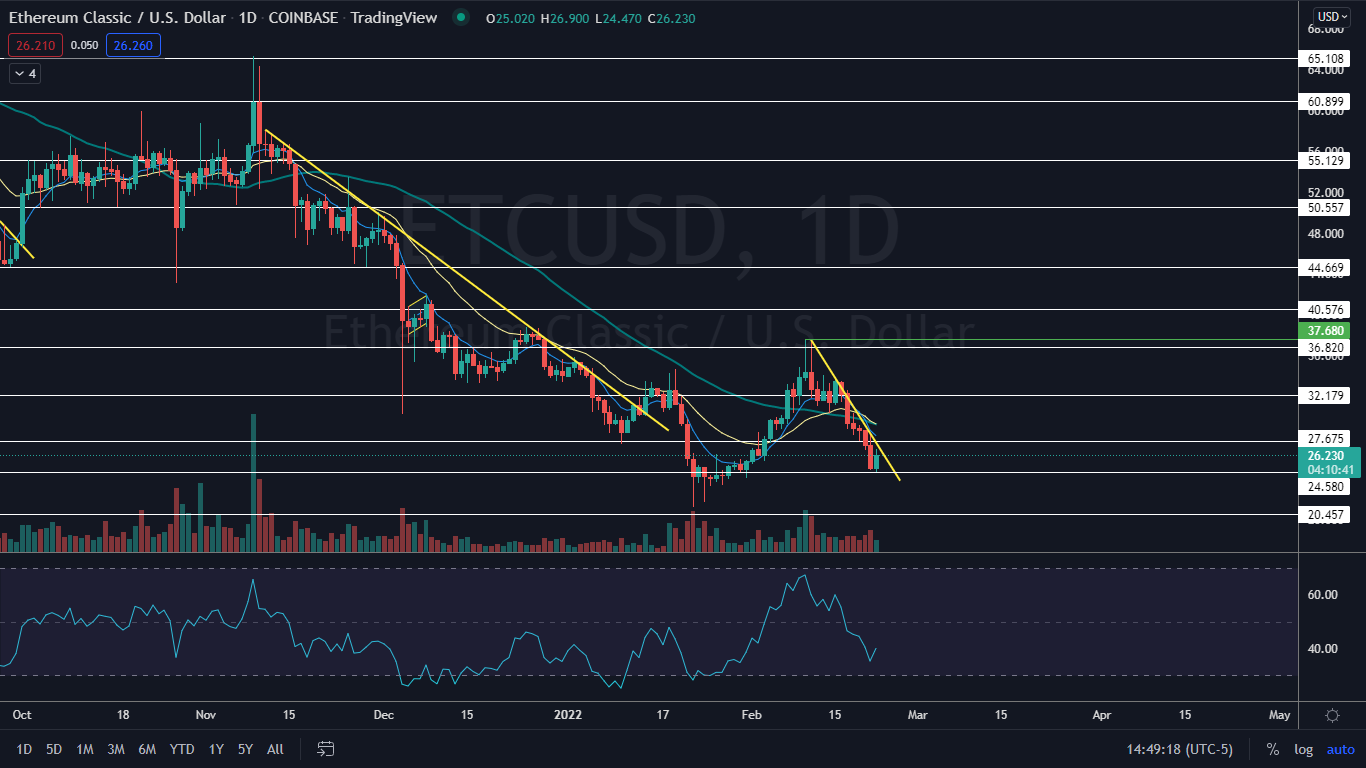
The Ethereum Classic Chart: When Ethereum Classic shot up on Tuesday, the crypto was rejected at a descending trendline that has been holding it down since Feb. 11 when it printed a bearish double top pattern at the $37.68 level. Ethereum Classic has been trading in a steep downtrend beneath the trendline, making a consistent series of lower highs and lower lows, with the most recent lower high formed on Feb. 16 near $33.50 and the most recent lower low likely printing on Tuesday.
If Ethereum Classic closes the 24-hour trading session near its high-of-day price, it will print a bullish Marubozu candlestick, which may indicate higher prices will come on Wednesday. If higher prices do come, the crypto will break up bullishly from the descending trendline, which could be a powerful reversal signal. Traders and investors not already in a position can watch for higher-than-average volume to enter on the break to gauge whether the pattern was recognized.
Ethereum Classic is trading below the eight-day and 21-day exponential moving averages (EMAs), with the eight-day EMA trending below the 21-day, both of which are bearish indicators. The crypto is also trading below the 50-day simple moving average, which indicates longer-term sentiment is bearish.
Want direct analysis? Find me in the BZ Pro lounge! Click here for a free trial.
- Bulls want to see big bullish volume come in and break Ethereum Classic up from the descending trendline and then for bullish momentum to cause the crypto to regain support at the eight-day and 21-day EMAs. Ethereum Classic has resistance above at $27.65 and $32.17.
- Bears want to see Ethereum Classic continue to be pushed lower by the descending trendline until it loses support at the 24.58 level. Below the area, there is further support at $20.45 and $15.27.

Photo: Courtesy of ETC on Flickr
Edge Rankings
Price Trend
© 2025 Benzinga.com. Benzinga does not provide investment advice. All rights reserved.
Trade confidently with insights and alerts from analyst ratings, free reports and breaking news that affects the stocks you care about.