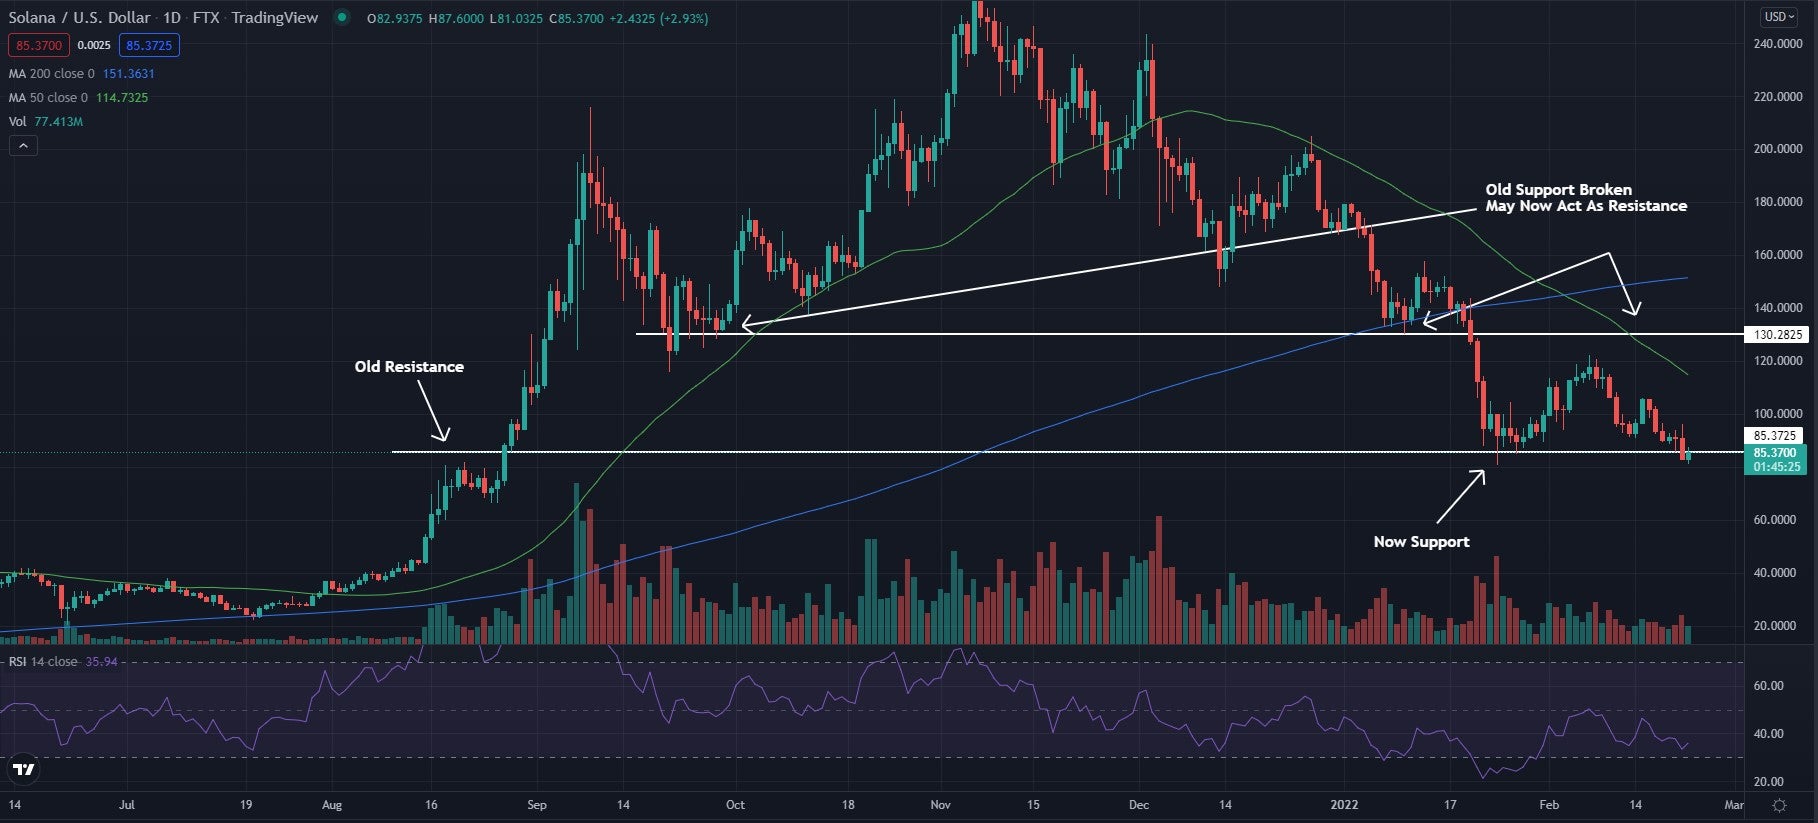
Solana SOL/USD, a layer one cryptocurrency similar to Ethereum ETH/USD, is trading higher Tuesday as it sits near a key level that has been both resistance and support in the past. This level will need to hold for bulls to see a possible turnaround in the coming weeks. If unable to turn around, the crypto may see a strong bearish move and continue to head lower.
Solana was up 2.84% at $85.29 at time of publication.
See Also: How To Buy Solana
Solana Daily Chart Analysis
- Solana is sitting right above the $85 level, an area that once acted as resistance then later turned into an area of support. Now, the stock is looking to see this area turn into support once again.
- The crypto trades below both the 50-day moving average (green) and the 200-day moving average (blue). This shows the crypto is trading with bearish sentiment and each of these moving averages may hold as an area of resistance in the future.
- The Relative Strength Index (RSI) has been fading lower over the past few days and now sits at 36. This shows that more sellers have been moving into the stock as it approaches the support level. If the crypto falls into the oversold region as it breaks below support, the price could see a strong bearish move.

What’s Next For Solana?
Bullish traders want to see a bounce off support and for the crypto to begin to form higher lows. Bulls want to see the higher lows push higher and the price to test the $130 area, eventually breaking above and being able to cross the moving averages once again.
Bearish traders want to see the price fall below the $85 level and begin to hold it as an area of resistance. This could cause a further bearish move.
Edge Rankings
Price Trend
© 2025 Benzinga.com. Benzinga does not provide investment advice. All rights reserved.
Trade confidently with insights and alerts from analyst ratings, free reports and breaking news that affects the stocks you care about.