Zinger Key Points
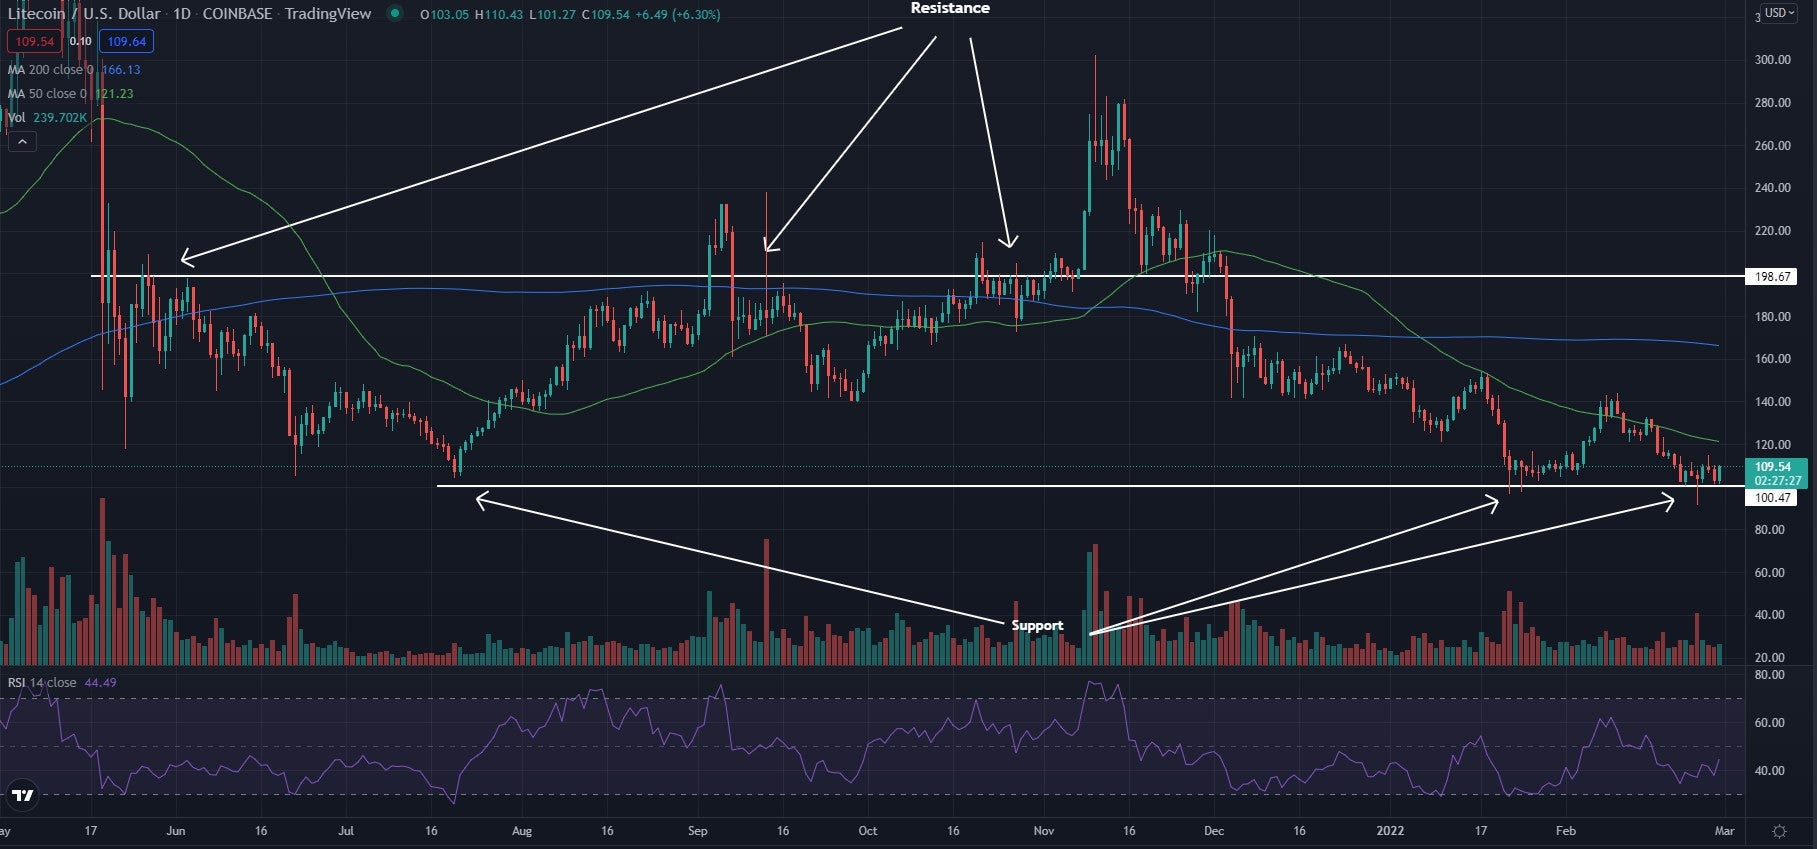
- Litecoin looks to be bouncing off the $100 support level, traders are looking to see the stock begin to form higher lows and move toward the $200 resistance level.
- The Relative Strength Index has been climbing the past few days and now sits at 44, indicating there are slightly more sellers overall.
- Feel unsure about the market’s next move? Copy trade alerts from Matt Maley—a Wall Street veteran who consistently finds profits in volatile markets. Claim your 7-day free trial now.
Litecoin LTC/USD is trading higher Monday and looks to be bouncing off support in a sideways channel. The crypto has been in a steady downward trend for the past few months, but could be turning around if the support level can hold.
Litecoin was up 6.28% at $109.52 at time of publication.
Related: After Trading Lower, Will Litecoin Get Its Groove Back?
Litecoin Daily Chart Analysis
- Litecoin looks to be bouncing off the $100 support level, as it has a few times in the past. For this bounce to be confirmed, traders are looking to see the stock begin to form higher lows and start to push further away from the support zone toward the $200 resistance level.
- The crypto trades below both the 50-day moving average (green) and the 200-day moving average (blue), indicating that Litecoin has been trading with recent bearish sentiment. Both of these moving averages may hold as an area of resistance in the future.
- The Relative Strength Index (RSI) has been climbing the past few days and now sits at 44. This shows that there are slightly more sellers overall, although there have been more buyers moving into the market recently. If buyers continue to move into the market, there may soon be more buyers overall.

What’s Next For Litecoin?
Litecoin is sitting right on top of the support line and may be setting up for a bounce. This bounce could bring about a bullish trend in the future if the crypto can start to form higher lows. If unable to hold above support and Litecoin begins to turn the $100 level into resistance, it may be ready for a strong bearish move.
Bullish traders are looking to see higher lows and the RSI to cross above the middle line. Bulls would then like to see the stock cross above the moving averages.
Bearish traders are looking for the RSI to stay below 50 and for the price to hold the $100 level as resistance for a possible strong bearish move.
© 2025 Benzinga.com. Benzinga does not provide investment advice. All rights reserved.
Trade confidently with insights and alerts from analyst ratings, free reports and breaking news that affects the stocks you care about.