Ethereum Classic ETC/USD was trading flat on Tuesday, in line with Bitcoin BTC/USD and Ethereum ETH/USD, which were muted as the cryptocurrency market appeared to await the release of the Federal Reserve’s monthly minutes on Wednesday at 2:00 p.m.
The central bank is widely expected to raise the interest rate by 25 basis points, in an effort to combat soaring inflation, but if the fed decides to hike rates higher or leave the interest rate at zero, the crypto sector and general markets could react wildly.
The Russia-Ukraine crisis has also weighed heavily on investors, with at least some preferring to hold cash positions until geopolitical risks lessen and others piling into gold, which is considered the more traditional safe-haven asset.
The crypto sector has become frustrating for bullish investors because it now appears to have entered into a long-term bear cycle, with little indication of direction and many of the most popular coins continuing to trade sideways.
If a catalyst hits, volatility could enter into the sector and Ethereum Classic is likely to follow the apex cryptos. Although negative news could cause Ethereum Classic to break down from the horizontal pattern the crypto has been trading in since Jan. 5, Ethereum Classic’s chart currently leans bullish.
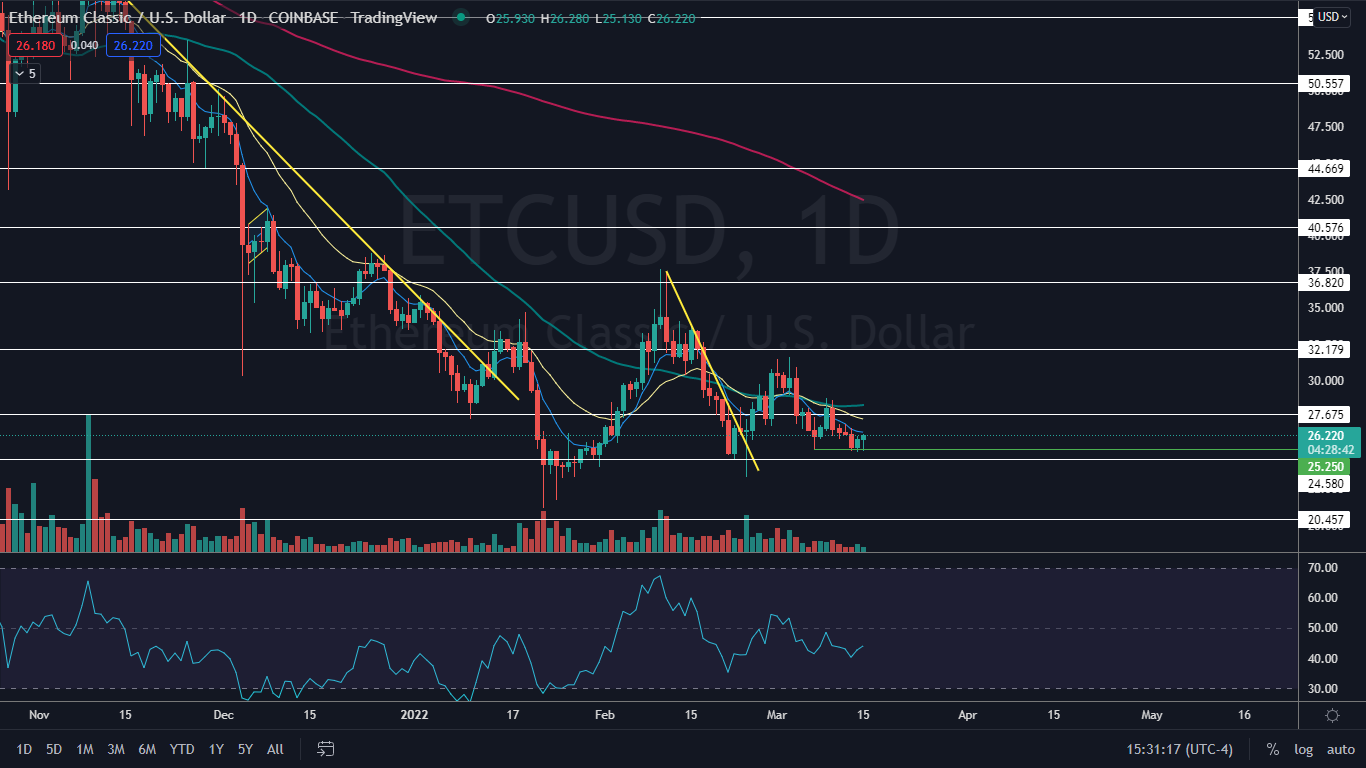
The Ethereum Classic Chart: Ethereum Classic has been trading sideways between about $21.10 and $36.80 since that date, but on Wednesday the crypto tested the $25.25 level as support and bounced. The price action, when combined with similar price activity on March 7, Sunday and Monday, has set Ethereum Classic into a bullish quadruple bottom pattern on the daily chart.
If the pattern is recognized, bullish traders will want to see Ethereum Classic rise up on Wednesday and regain support at the eight-day exponential moving average (EMA), which is currently acting as resistance.
If Ethereum Classic reacts bearishly to any upcoming catalyst, traders can watch for the crypto to break below that level on higher-than-average volume, which could indicate a strong move to the downside is on the horizon.
Ethereum Classic has developed medium bullish divergence on its chart, as the relative strength index has made a series of lower highs, while the crypto’s lows have remained flat. Medium bullish divergence indicates a bounce may be in the cards.
Ethereum Classic is trading below the eight-day and 21-day EMAs, with the eight-day EMA trending below the 21-day, both of which are bearish indicators. The EMAs are trading in line with the 50-day simple moving average, however, and if Ethereum Classic can regain all three moving averages as support, a strong sentiment change could quickly take place.
Ethereum Classic has resistance above at $27.65 and $32.17 and support below at $24.58 and $20.45.
Want direct analysis? Find me in the BZ Pro lounge! Click here for a free trial. 
Photo: Courtesy of ETC on Flickr
Edge Rankings
Price Trend
© 2025 Benzinga.com. Benzinga does not provide investment advice. All rights reserved.
Trade confidently with insights and alerts from analyst ratings, free reports and breaking news that affects the stocks you care about.