


Zinger Key Points
- On Monday, Bitcoin looked to be printing a doji candlestick, which could indicate the break from the bull flag will come on Tuesday, as a doji is a reversal candlestick.
- If higher prices do come, the doji will also mark the higher low of a new uptrend pattern that Benzinga called out Sunday.
- China’s new tariffs just reignited the same market patterns that led to triple- and quadruple-digit wins for Matt Maley. Get the next trade alert free.
Bitcoin BTC/USD has settled into a bullish flag pattern on the daily chart. The bull flag pattern is created with a sharp rise higher forming the pole, which is then followed by a consolidation pattern that brings the stock lower between a channel with parallel lines.
- For bearish traders, the "trend is your friend" (until it's not) and the stock may continue downward within the following channel for a short period of time. Aggressive traders may decide to short the stock at the upper trendline and exit the trade at the lower trendline.
- Bullish traders will want to watch for a break up from the upper descending trendline of the flag formation, on high volume, for an entry. When a stock breaks up from a bull flag pattern, the measured move higher is equal to the length of the pole and should be added to the lowest price within the flag.
A bull flag is negated when a stock closes a trading day below the lower trendline of the flag pattern or if the flag falls more than 50% down the length of the pole.
The Bitcoin Chart: On March 16, Bitcoin broke up from a descending triangle pattern on the daily chart and the move, combined with the upwards trend between March 14 and March 19, may be the pole of a bull flag pattern, with the move slightly lower on Sunday and Monday forming the flag.
If the pattern is recognized, the measured move is about 13%, which indicates Bitcoin could soar toward the $45,400 level in the future.
- If big bullish volume comes in on the break of the upper descending trendline of the flag, Bitcoin could reach the level quickly due to its inherent volatility.
- On Monday, Bitcoin looked to be printing a doji candlestick, which could indicate the break from the bull flag will come on Tuesday, as a doji is a reversal candlestick. If higher prices do come, the doji will also mark the higher low of a new uptrend pattern that Benzinga called out Sunday.
- The consolidation on Monday was being made on lower-than-average volume, which is healthy and indicates a lack of selling pressure. By midafternoon, Bitcoin’s volume was measuring in at about 8,700 compared to the 10-day average of 11,937.
- Bitcoin has resistance above at $42,223 and $45,814 and support below at $39.600 and $38.105.
Want direct analysis? Find me in the BZ Pro lounge! Click here for a free trial.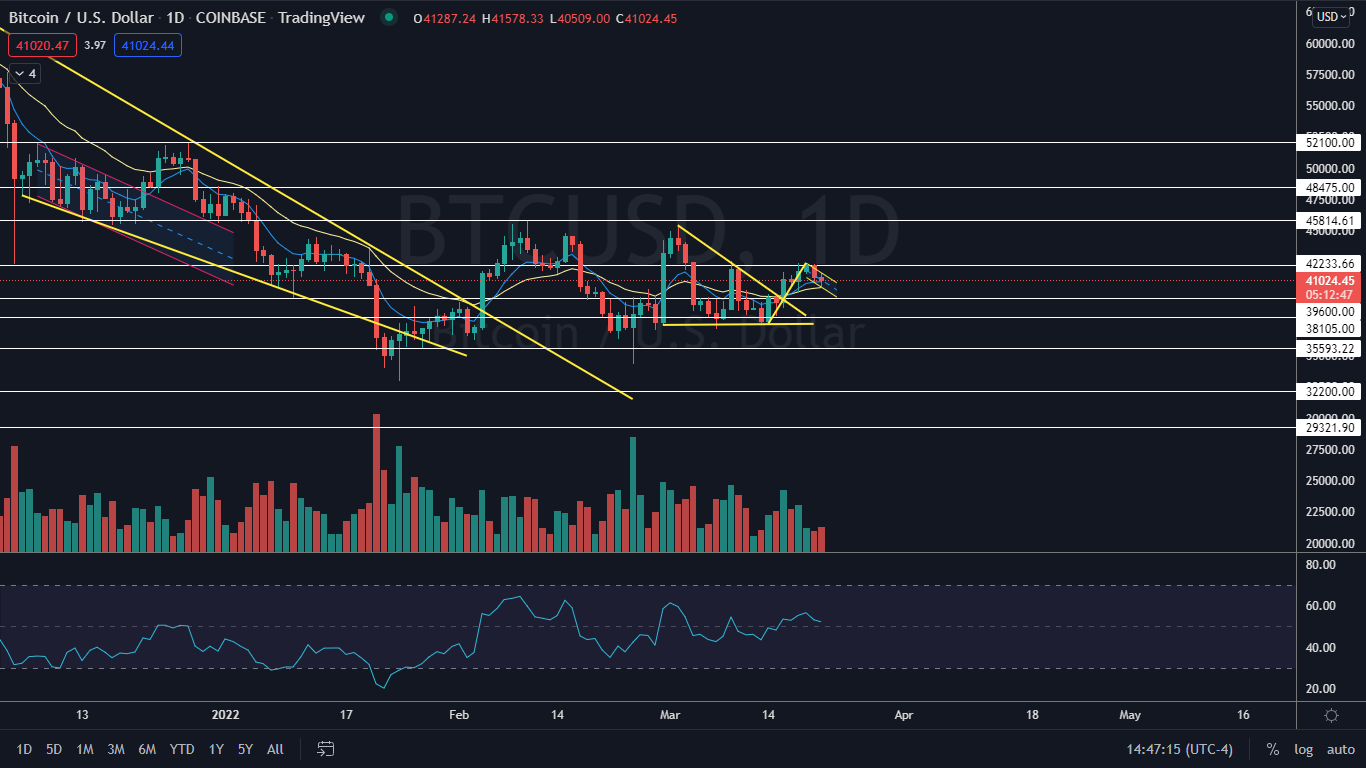
Edge Rankings
Price Trend
© 2025 Benzinga.com. Benzinga does not provide investment advice. All rights reserved.
Trade confidently with insights and alerts from analyst ratings, free reports and breaking news that affects the stocks you care about.

