


Zinger Key Points
- A close of the 24-hour trading session below the 200-day SMA would likely negate the bull flag pattern.
- The move lower on Sunday was on far lower-than-average volume, indicating a healthy consolidation.
- Feel unsure about the market’s next move? Copy trade alerts from Matt Maley—a Wall Street veteran who consistently finds profits in volatile markets. Claim your 7-day free trial now.
Ethereum Classic ETC/USD was trading about 5% lower on Sunday after breaking down bearishly from a quadruple inside bar pattern on the daily chart. The break came on lower-than-average volume, however, which indicates the inside bars may not be the dominant pattern.
Instead, Ethereum Classic could be setting up a bull flag pattern, and if the pattern is recognized a massive move to the upside could be in the cards.
The bull flag pattern is created with a sharp rise higher forming the pole, which is then followed by a consolidation pattern that brings the stock lower between a channel with parallel lines.
- For bearish traders, the "trend is your friend" (until it's not) and the stock may continue downwards within the following channel for a short period of time. Aggressive traders may decide to short the stock at the upper trendline and exit the trade at the lower trendline.
- Bullish traders will want to watch for a break up from the upper descending trendline of the flag formation, on high volume, for an entry. When a stock breaks up from a bull flag pattern, the measured move higher is equal to the length of the pole and should be added to the lowest price within the flag.
A bull flag is negated when a stock closes a trading day below the lower trendline of the flag pattern, or if the flag falls more than 50% down the length of the pole.
See Also: Bitcoin Bull Cathie Wood Loads Up $30M Worth Of Shares In This Crypto-Linked Fintech On Friday
The Ethereum Classic Chart: If Ethereum Classic is settling into a bull flag pattern, the measured move on a break from the formation is a massive 116%, which indicates the crypto could skyrocket up toward the $98 level. Traders and investors can watch for an upward break from the upper descending trendline of the flag formation on higher-than-average volume to indicate whether the bull flag pattern is recognized.
- The sideways consolidation within the flag pattern has helped Ethereum Classic’s eight-day exponential moving average (EMA) to catch up to the crypto’s price. Ethereum Classic may find support at the eight-day EMA, but if the crypto falls below the level, there is further support at the 200-day simple moving average. If Ethereum Classic were to close a 24-hour trading session below the 200-day SMA, it would most likely negate the bull flag pattern.
- The move lower on Sunday was on far lower-than-average volume, which further confirms the sell-off is due to healthy consolidation as opposed to a mass exodus of sellers. By early afternoon, the crypto’s volume was measuring in at just 159,294 compared to the 10-day average of 832,082.
- Ethereum Classic has resistance above at $47.92 and $50.74 and support below at $44.66 and $41.41.
Want direct analysis? Find me in the BZ Pro lounge! Click here for a free trial. 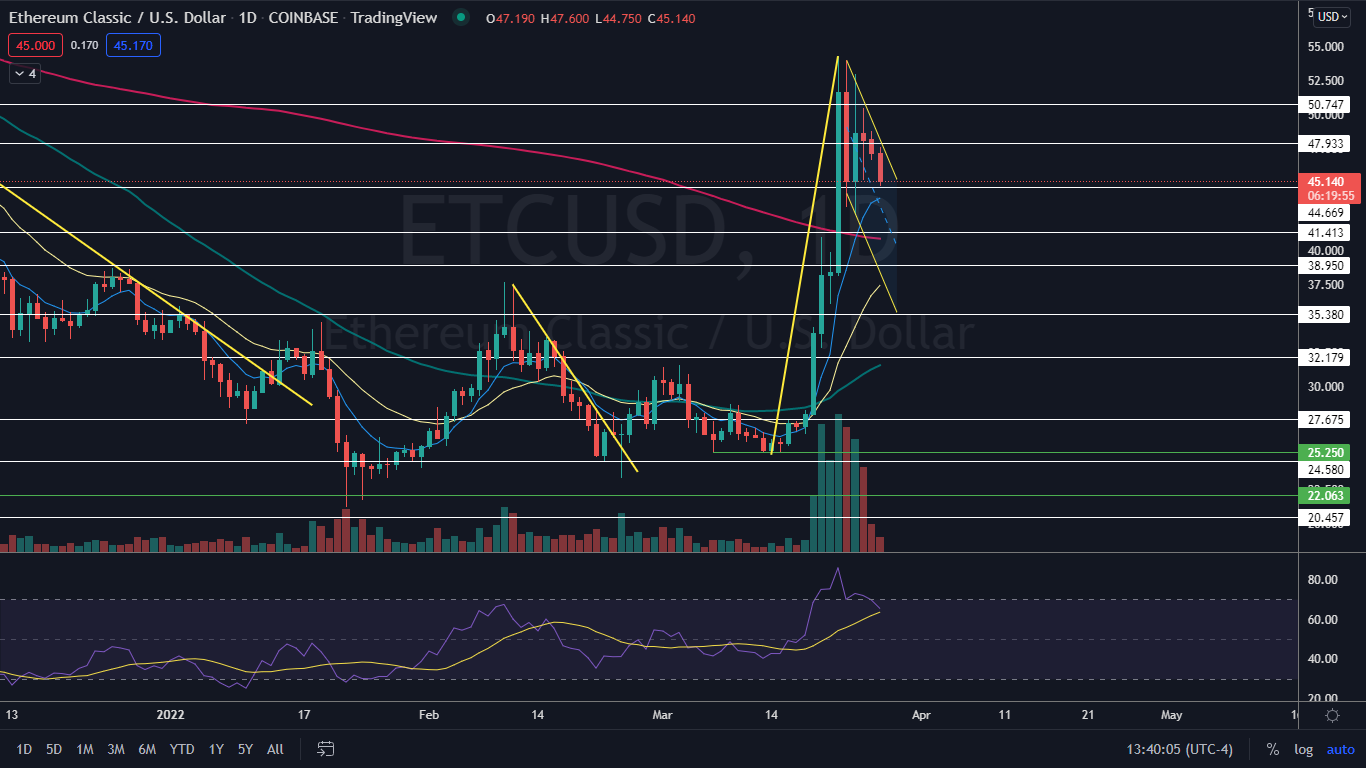
See Also: How to Read Candlestick Charts for Beginners
Photo: Courtesy of ETC on Flickr
Edge Rankings
Price Trend
© 2025 Benzinga.com. Benzinga does not provide investment advice. All rights reserved.
Trade confidently with insights and alerts from analyst ratings, free reports and breaking news that affects the stocks you care about.

