Zinger Key Points
- Bitcoin, Ethereum, Dogecoin trade in the green on Monday
- Robust dollar acting as a headwind to cryptocurrency market - Delphi Digital
- Bitcoin prices in semi-bullish territory, says Santiment
- Next: Get access to a new market-moving chart every day featuring a stock flashing clear technical signals. See today's pick now.
Bitcoin and Ethereum were trading in the green at press time as the global cryptocurrency market cap rose 2.9% to $1.9 trillion on Monday evening.
| Coin | 24-hour | 7-day | Price |
|---|---|---|---|
| Bitcoin BTC/USD | 3% | 3.45% | $40,956.93 |
| Ethereum ETH/USD | 2.8% | 3.2% | $3,077.28 |
| Dogecoin DOGE/USD | 0.6% | 4.4% | $0.14 |
| Cryptocurrency | 24-Hour % Change (+/-) | Price |
|---|---|---|
| STEPN (FTT) | +33.9% | $3.25 |
| Terra (LUNA) | +18% | $91.33 |
| Zcash (ZEC) | +13.7% | $156.43 |
See Also: How To Get Free NFTs
Why It Matters: Bitcoin and Ethereum trading volumes rose on Monday. The 24-hour trading of both coins shot up by nearly 75% to $33.89 billion and $18.76 billion, respectively, according to CoinMarketCap data.
Among other risk assets, the S&P 500 and Nasdaq futures rose 0.5% and 0.7%, respectively, at press time as the market gears up for a busy earnings week.
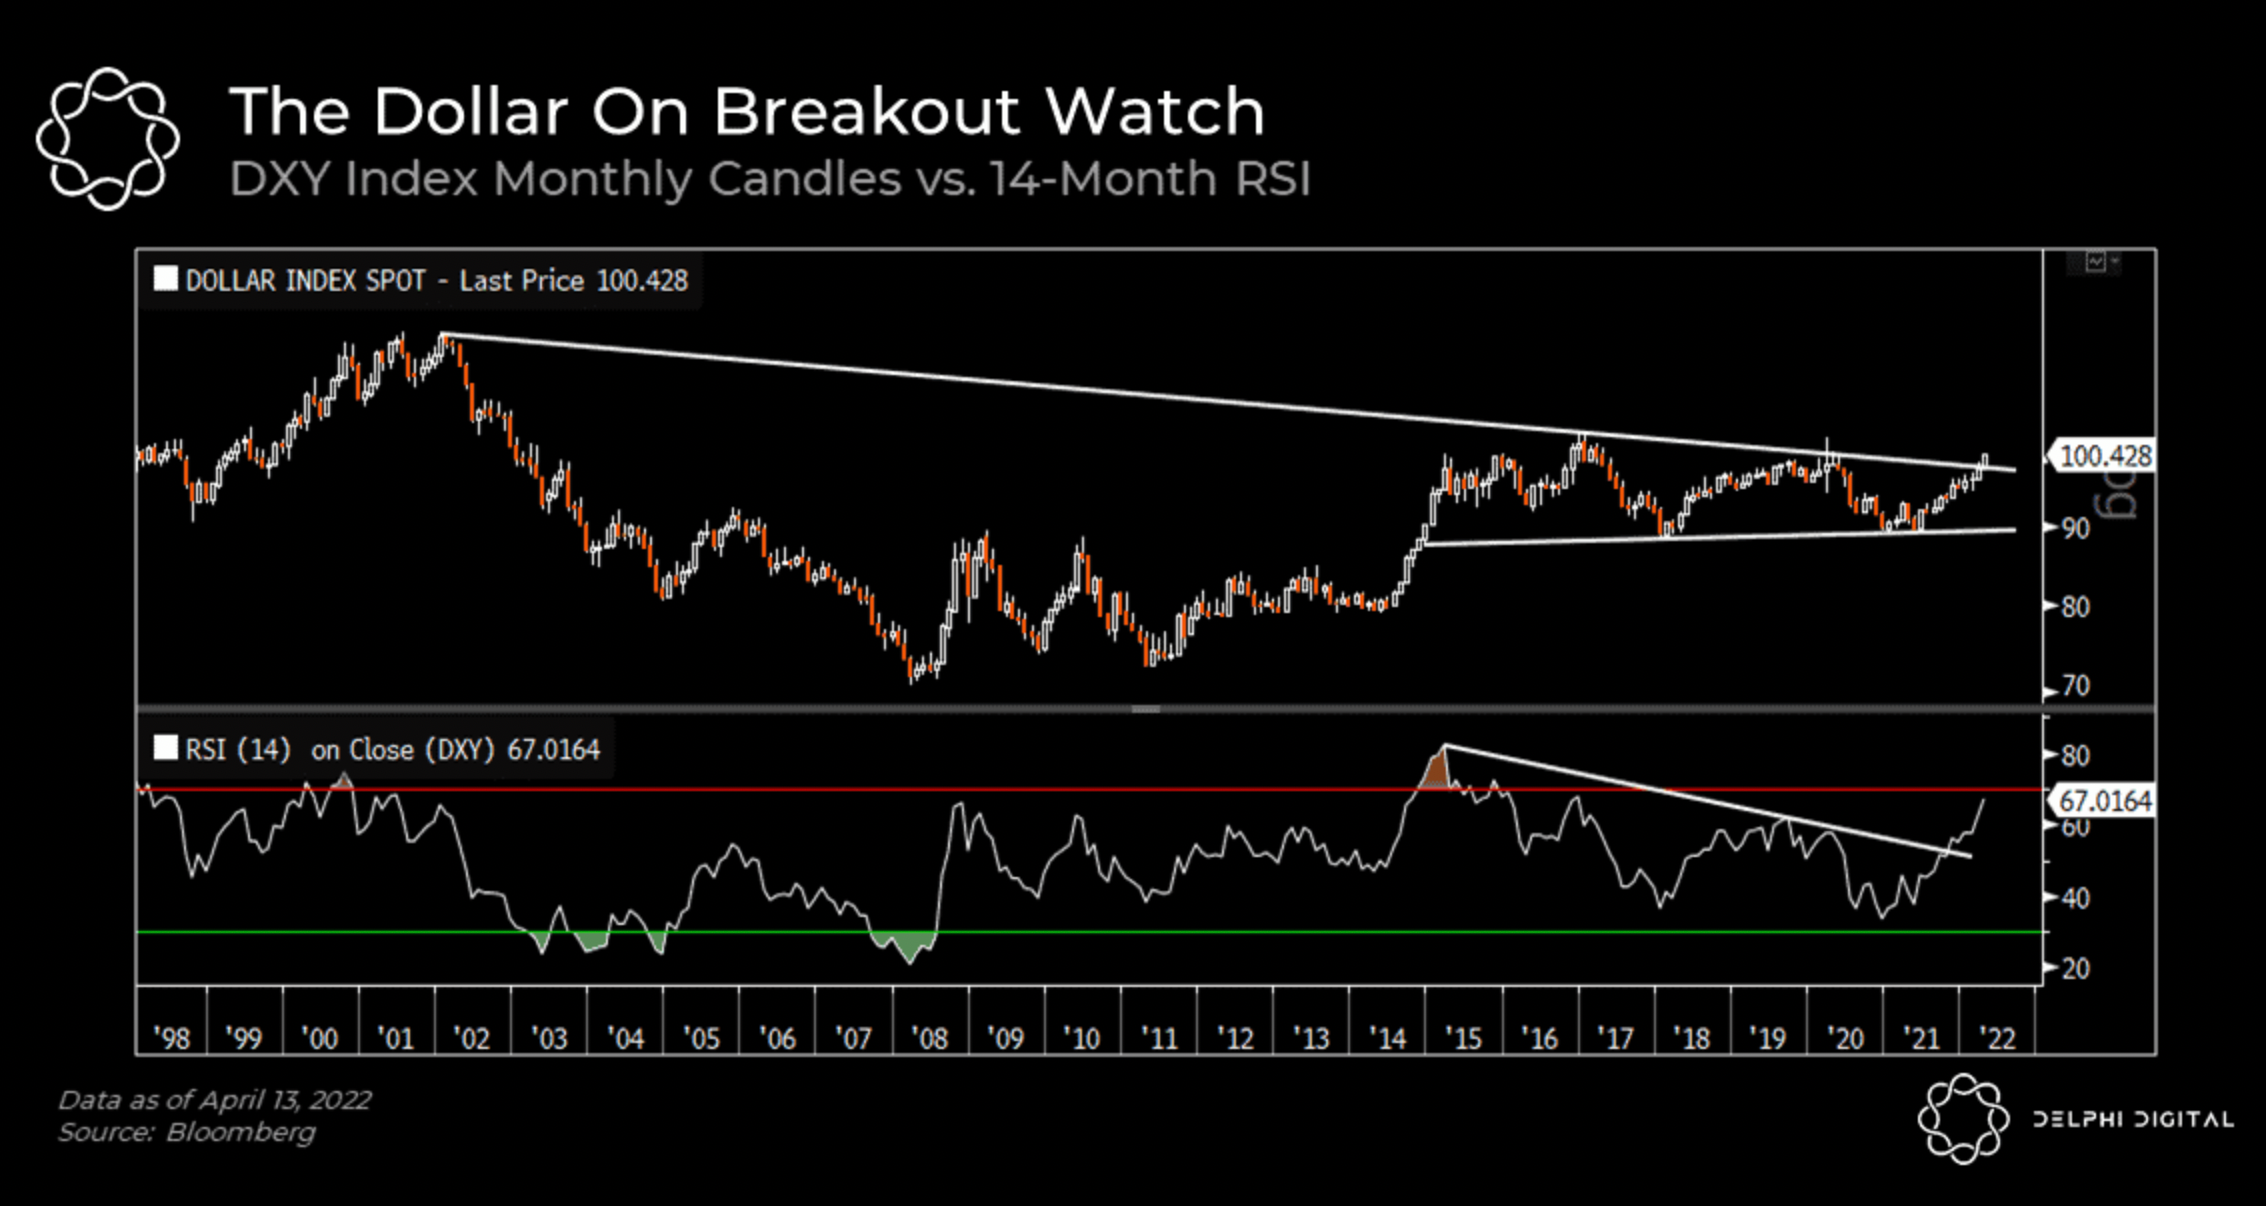
The dollar exhibited strength against both the yen and the euro. The dollar index, a measure of the greenback’s strength against six other currencies, rose to a two-year high of 100.86, according to a Reuters report.
The strength of the dollar is a headwind against the cryptocurrency market, according to Delphi Digital.
“As BTC struggles to keep its head above $40K, the US Dollar Index (DXY) just broke 100 for the first time in almost two years,” said the independent research firm.
“The greenback is now on the verge of a multi-decade breakout as two of its major currency pairs (EUR and JPY) are both vulnerable to technical breakdowns of their own. The EUR and JPY make up ~70% of the DXY Index.”
 DXY Monthly Candles Vs. 14-Monthly Relative Strength Index (RSI) — Via Glassnode
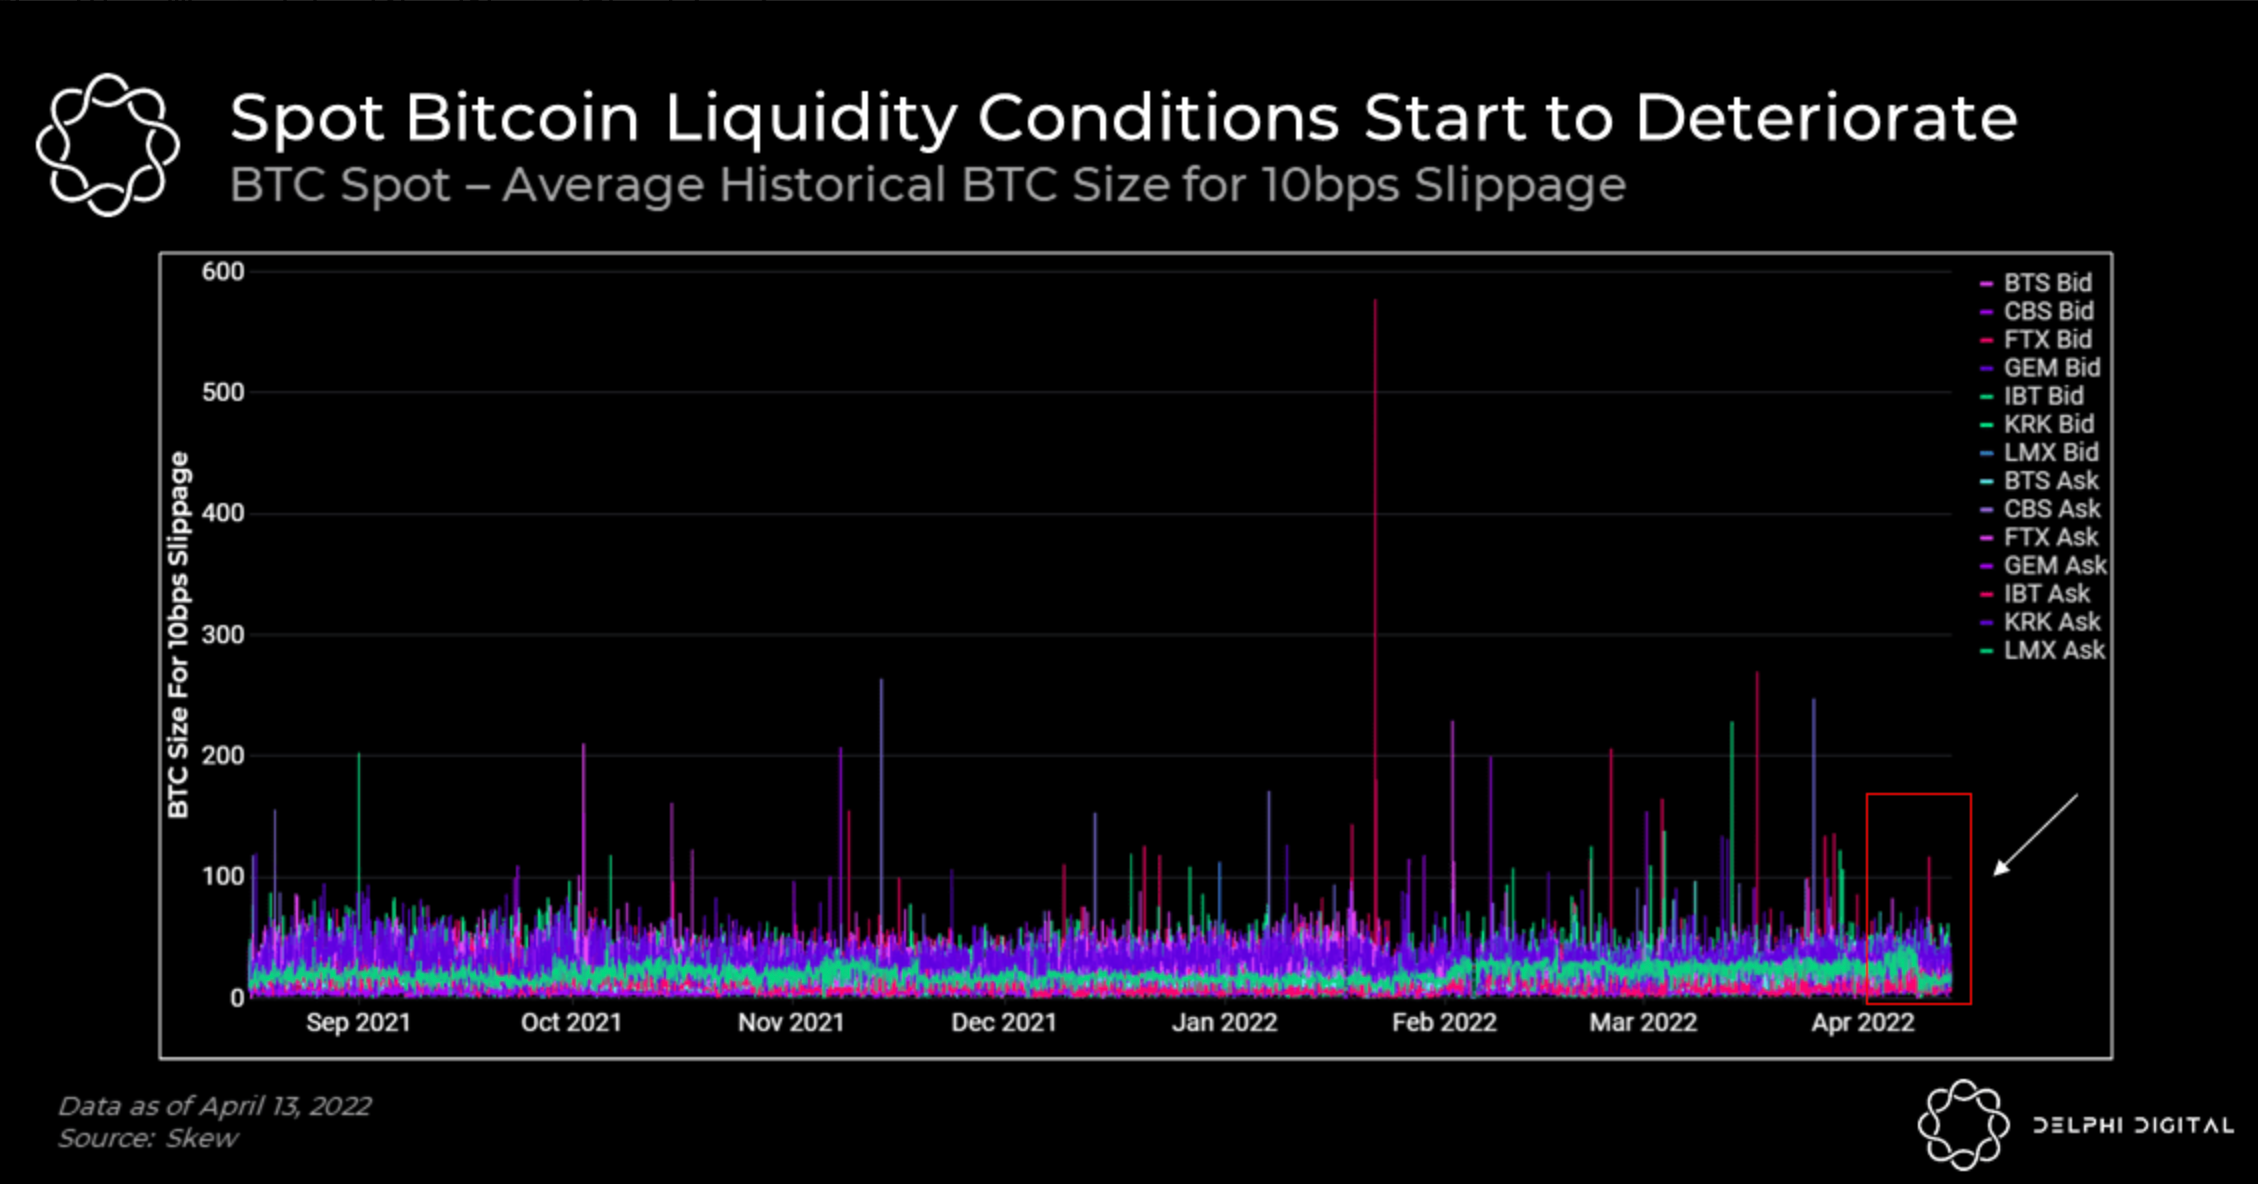
Another factor working against the apex coin is liquidity, according to Delphi Digital. Pointing to the difference between the expected price of a trade and the price at which it is executed, or slippage, Delphi Digital said over the last weeks it has observed the average size of a BTC order incurring 10 bps of slippage.
“This could be a warning sign for spot market liquidity should this trend persist,” said Delphi Digital.
 Average Historical BTC Size For 10 bps Slippage — Courtesy Glassnode
Market intelligence platform, Santiment, said that Bitcoin’s MVRV (Market Value to Realized Value) indicates that prices are in the semi-bullish territory.
Santiment said in a tweet, “Average traders who have invested in $BTC are currently down -10.4%. This metric fluctuates at 0%, so there is less risk in buying while traders are well in the red here.”
#Bitcoin's 30-day MVRV indicates that prices are still in a semi-#bullish area. Average traders who have invested in $BTC are currently down -10.4%. This metric fluctuates at 0%, so there is less risk in buying while traders are well in the red here. https://t.co/MpDUaOCT8q pic.twitter.com/j4eFo7Vcon
— Santiment (@santimentfeed) April 18, 2022
© 2025 Benzinga.com. Benzinga does not provide investment advice. All rights reserved.
Trade confidently with insights and alerts from analyst ratings, free reports and breaking news that affects the stocks you care about.