


Zinger Key Points
- Bitcoin’s relative strength index has reached oversold territory, measuring in below the 30% level.
- On Monday, Ethereum was testing and holding above the bottom descending trendline of a falling channel pattern.
- China’s new tariffs just reignited the same market patterns that led to triple- and quadruple-digit wins for Matt Maley. Get the next trade alert free.
Bitcoin BTC/USD and Ethereum ETH/USD were trading over 4% and 5% lower, respectively, on Monday. The move lower is the continuation of a downtrend, which escalated on May 5.
Since that date, Bitcoin has plunged over 18% and Ethereum has plummeted about 19%, as fear of a recession has gripped traders and investors, causing an accelerated move to the downside.
A recession takes place when economic activity begins to decline due to people deciding to spend less money and save more. Rising inflation and the Federal Reserve’s decision to continue hiking interest rates contributes to the cycle because purchasing everyday items becomes too expensive and investing cash becomes more lucrative.
The cryptocurrency sector is highly susceptible to a possible recession because its utility is entirely dependent on traders and investors using coins and tokens to pay for items.
No stock or crypto ever goes straight down, or up, and although Bitcoin and Ethereum could see more downside in the immediate future, at least a bounce is likely to eventually come.
Want direct analysis? Find me in the BZ Pro lounge! Click here for a free trial.
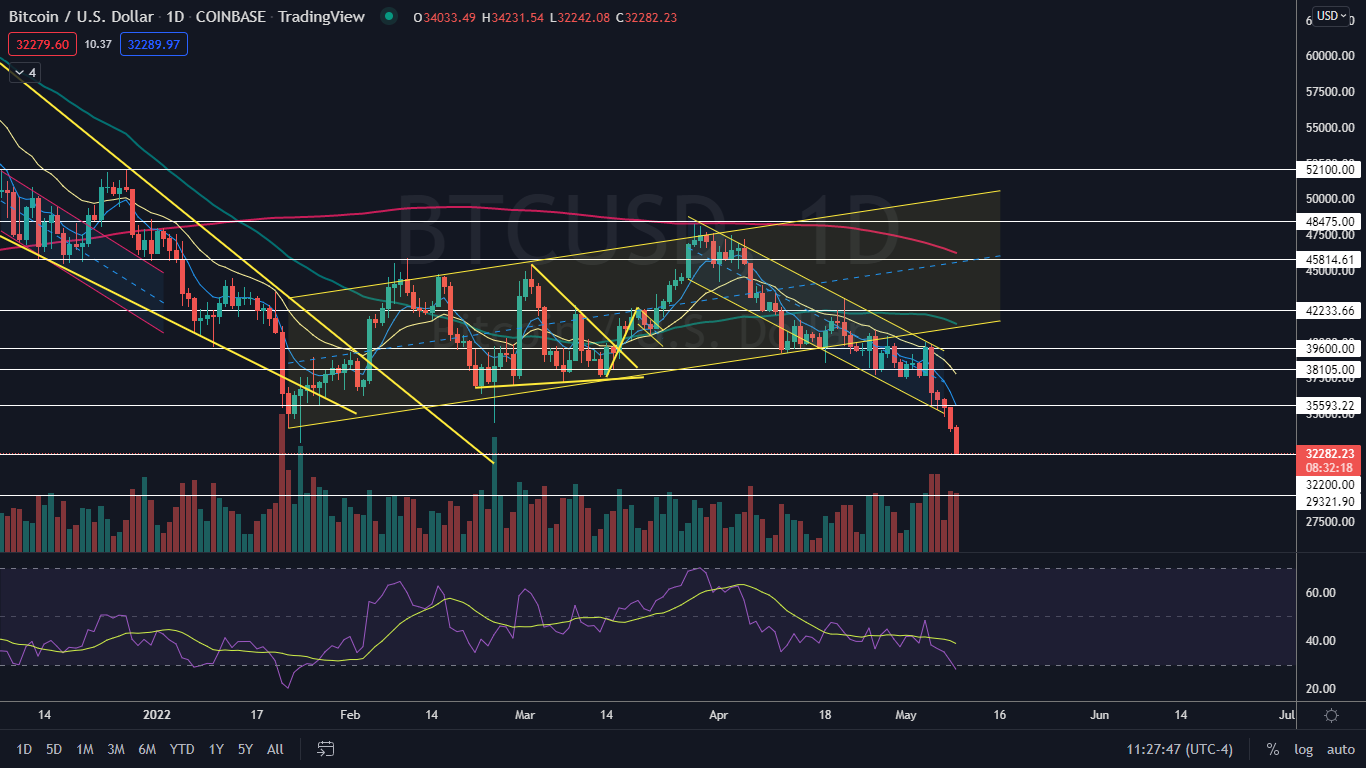
The Bitcoin Chart: On May 5, Bitcoin broke down bearishly from a falling channel pattern on higher-than-average volume, which caused extreme fear amongst traders and investors. The crypto has since fallen off a cliff, continuing to slide without bouncing up on the daily chart to form a higher low.
- The higher low will eventually come, which may provide an opportunity for bearish traders who aren’t already in a position, a solid entry point. The bounce could also provide bullish traders for a short-term opportunity to scalp trade the crypto.
- The bounce to the upside is likely to come over the new few trading sessions because Bitcoin’s relative strength index (RSI) has reached oversold territory, measuring in below the 30% level. Bullish traders can watch for a volume climax to occur, which could indicate the bears have become temporarily exhausted and have begun to cover their positions.
- Bitcoin has resistance above at $35,593 and $38,105 and support below at $32,200 and the 52-week low of $28,800.
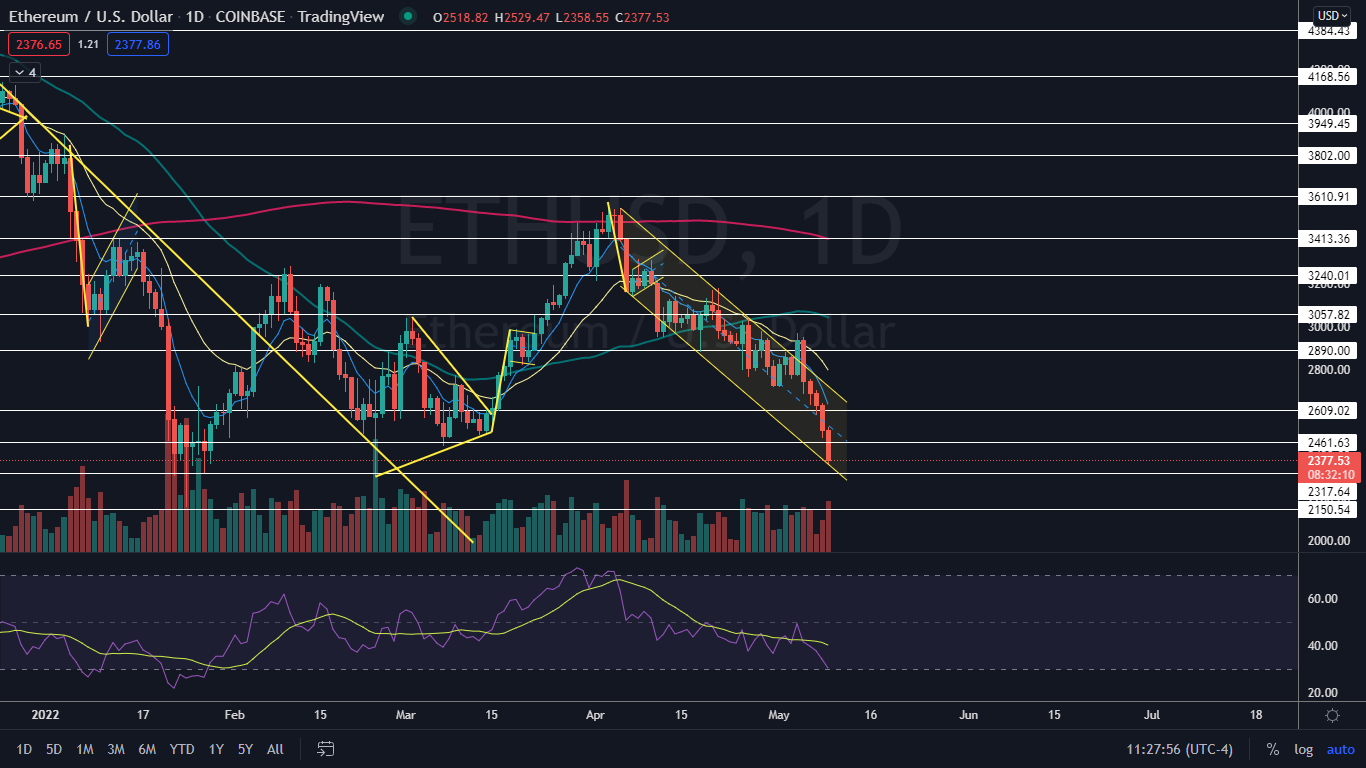
The Ethereum Chart: Unlike Bitcoin, Ethereum hasn’t yet broken bearishly from its own falling channel, which the crypto has been trading in since April 5. On Monday, Ethereum was testing the bottom descending trendline of the pattern and holding above the level, which is a positive sign for bullish traders.
- Like Bitcoin, Ethereum is likely to bounce up to form at least a lower high in the future because its RSI is approaching the 30% level. Bullish and bearish traders can also watch for a volume climax to take place, which could indicate a short-term reversal is in the cards.
- Ethereum has resistance above at $2,461 and $2,609 and support below at $2,317 and $2,150.
Edge Rankings
Price Trend
© 2025 Benzinga.com. Benzinga does not provide investment advice. All rights reserved.
Trade confidently with insights and alerts from analyst ratings, free reports and breaking news that affects the stocks you care about.

