Zinger Key Points
- The reality is we can adopt a whole manner of analysis techniques, which in the end will often prove futile in a range market due to the whipsaw nature of price.
- We can get an idea through our analysis of what price may do next, but it tends to be an uncontrollable animal when in consolidation.
- Feel unsure about the market’s next move? Copy trade alerts from Matt Maley—a Wall Street veteran who consistently finds profits in volatile markets. Claim your 7-day free trial now.
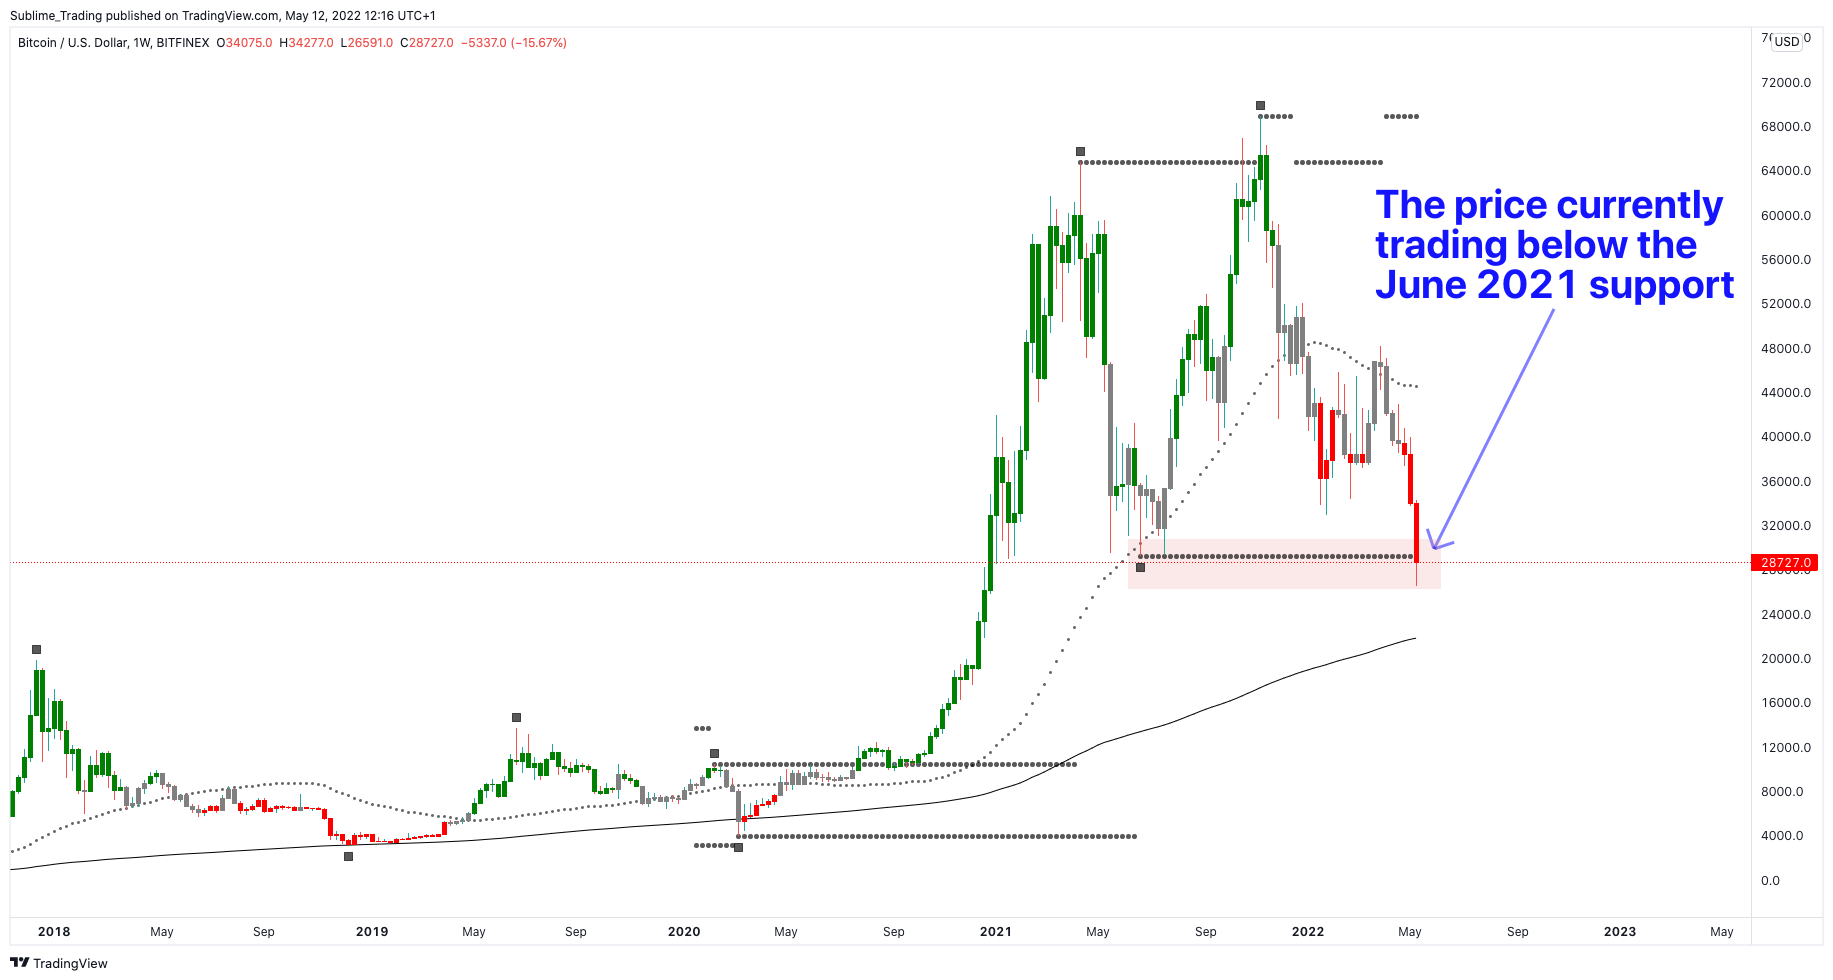
In yesterday's article on Bitcoin BTC/USD, I highlighted a support level where the price is trading around that has the potential to end its decline and encourage a reversal back to the upside.
The price, as of Thursday, trading below this level, but only just. I tend to look at these levels as zonal areas instead of hard levels. We will get a better idea if this level holds firm by the end of this week, or even the end of May, once we have confirmed closing prices. Fake breakouts are common at major levels of support and resistance.
Below I have Bitcoin's monthly time frame, updated from yesterday.

In today's article, I want to switch my attention to Ethereum ETH/USD, the second major currency in the crypto world. What Bitcoin does, Ethereum tends to follow. Some argue it is the opposite.
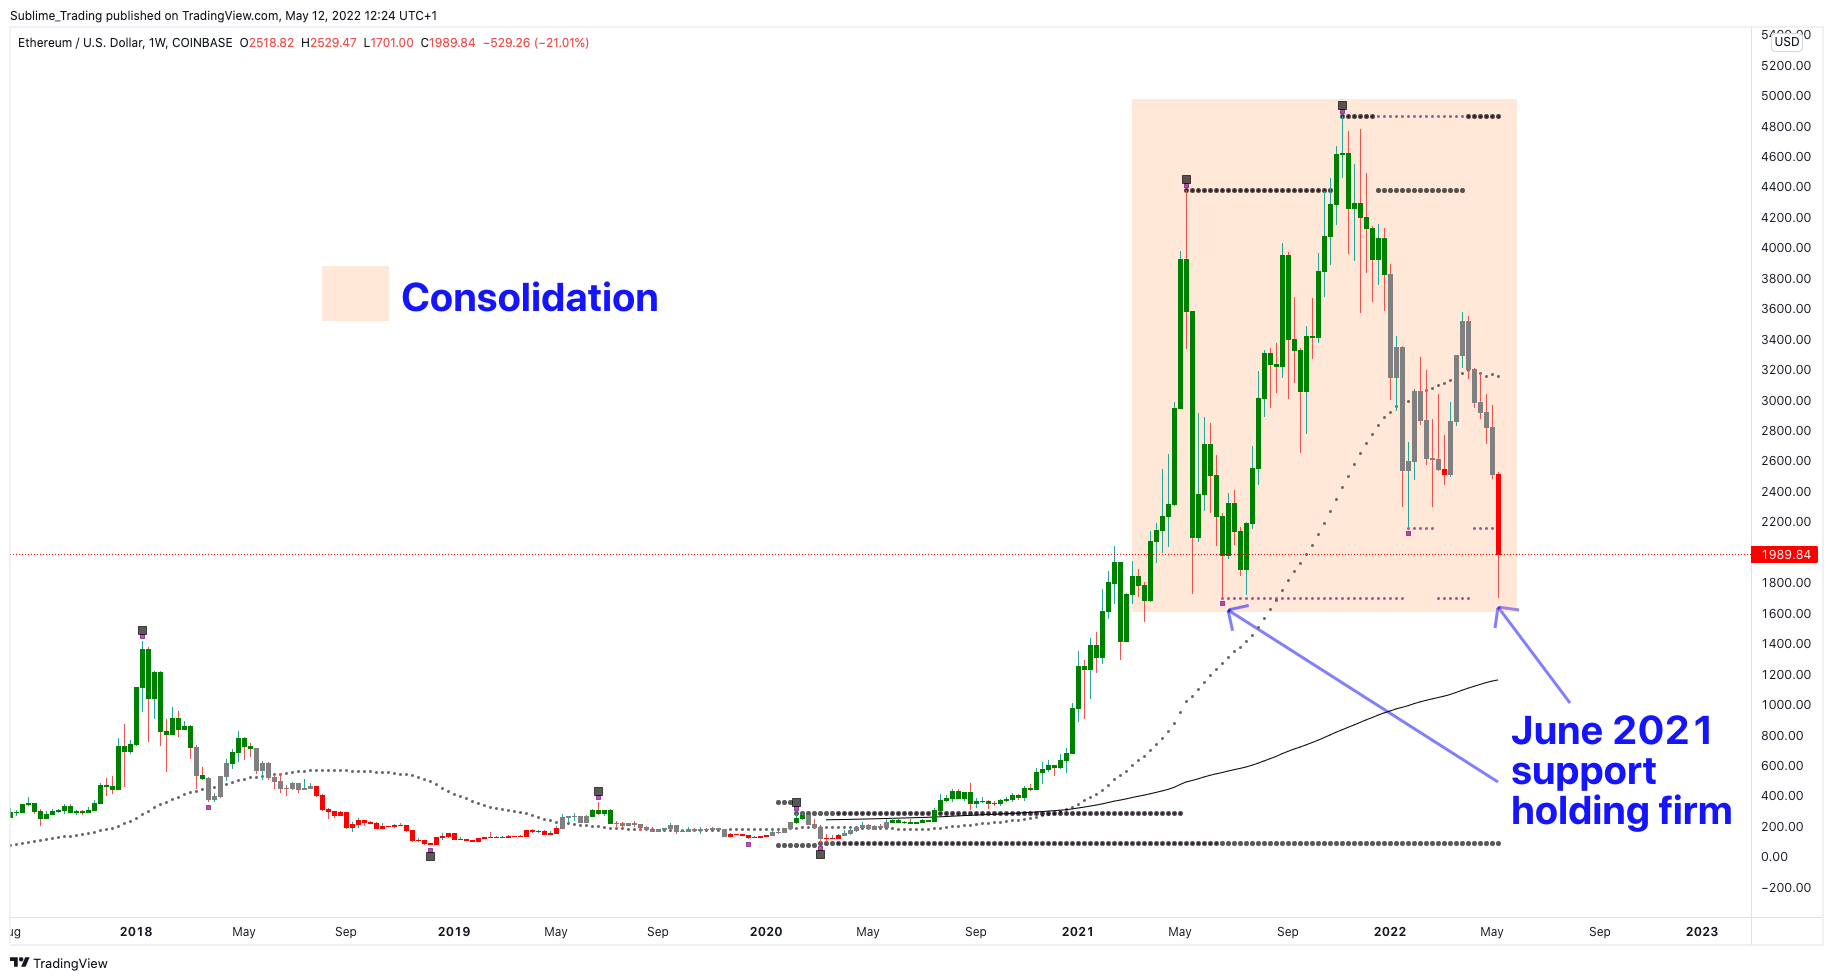
Below I have Ethereum's monthly time frame.

It displays an almost identical picture to Bitcoin, also printing a new all-time high in November 2021 at $5,000. Like Bitcoin, this new all-time high was short-lived, and the bears came in strong, pushing the price back into consolidation. From the November high to the current price action is a decline of 60%, including a drop of 25% this month.
So what's next for Ethereum?
Like Bitcoin, the price is at a major support level formed in June 2021, which is the base of this consolidation area. So far this month, this level is holding firm with a bounce of 13%, while Bitcoin is trading below this level. A close back above $2,000 by the end of the month would be potentially significant for strength back to the upside.
A break and close below the June 2021 support level could signal further weakness back to the weekly 200 simple moving average, the next major level of support, which was last tagged in July 2020.
When doing my analysis, I like to use the following criteria:
- The price as my primary indicator, as it is ultimately the source of truth.
- Support and resistance as my leading indicators of where the price is likely to move towards.
- Moving averages as my lagging indicators to confirm what price is suggesting.
Others like to take it further by using trend lines, Elliott Waves and Fibonacci levels, all of which I believe complicate matters further.
The reality is we can adopt a whole manner of analysis techniques, which in the end will often prove futile in a range market due to the whipsaw nature of price. We can get an idea through our analysis of what price may do next, but it tends to be an uncontrollable animal when in consolidation.
The good news is that price won't consolidate forever, and when it does break out, it is likely to trend for as long as it consolidates, potentially longer. So we have good times ahead to look forward to.
Until then, I believe that the best course of action to take during these market conditions is to stand aside, protect capital as best as possible and let the price dictate a breakout and a direction. This is where patience, a much-underappreciated investor skill, comes in.
As the saying goes, standing aside is also a position.
© 2025 Benzinga.com. Benzinga does not provide investment advice. All rights reserved.
Trade confidently with insights and alerts from analyst ratings, free reports and breaking news that affects the stocks you care about.