


Zinger Key Points
- On Sunday and Monday Dogecoin was finding support at the $0.085 mark and forming hammer candlesticks above that level.
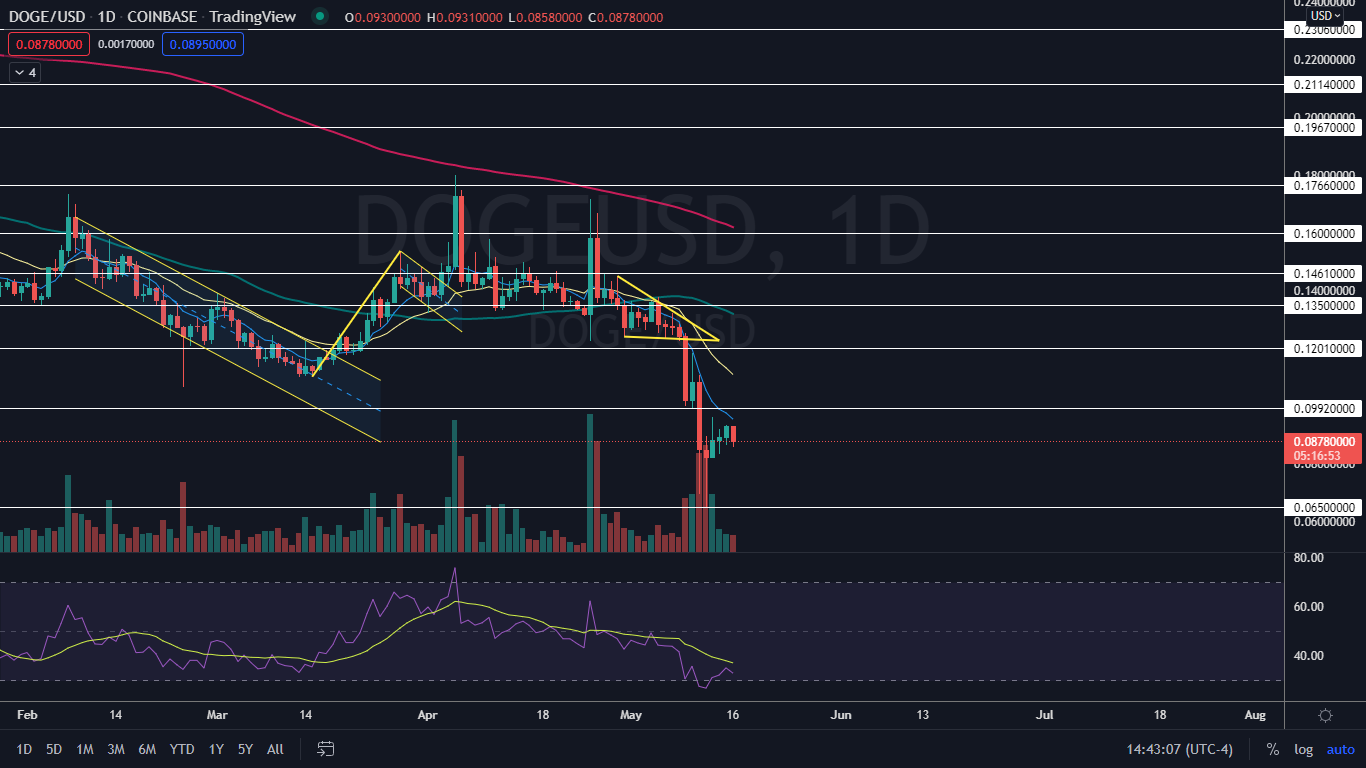
- Dogecoin has resistance above at $0.099 and at the 12-cent mark and support below at $0.065 and the psychologically important 5-cent level.
- Join Chris Capre on Sunday at 1 PM ET to learn the short-term trading strategy built for chaotic, tariff-driven markets—and how to spot fast-moving setups in real time.
Dogecoin DOGE/USD was trading down more than 5% on Monday in consolidation, after seeing whipsaw action between May 9 and May 13, which caused the crypto to plummet almost 48% to the $0.064 mark before bouncing up back up over the 8-cent mark on May 12.
The Shiba Inu-themed crypto is currently trading in a downtrend, although that might be set to change because on Sunday and Monday Dogecoin was finding support at the $0.085 mark and forming hammer candlesticks above that level.
A hammer candlestick pattern forms when a red or green candlestick prints, with a long lower wick and a short upper body, which resembles a hammer.
A hammer candlestick, when found in a downtrend, can indicate a reversal to the upside is on the horizon. It is a lagging indicator because the next candle on the timeframe being studied must print before the pattern can be validated.
A hammer candlestick doesn’t necessarily mean a new uptrend will occur, only that a bounce higher is likely imminent.
Candlestick patterns can be used to indicate the future price direction of a stock. Candlestick patterns are especially useful for technical traders when they are combined with other indicators such as larger patterns, trading volume, relative strength index (RSI) and divergences between RSI and price action.
Want direct analysis? Find me in the BZ Pro lounge! Click here for a free trial.
The Dogecoin Chart: If Dogecoin closes the trading day above its low-of-day price, it will form a second hammer candlestick, which could indicate higher prices will come on Tuesday. If that happens, Dogecoin’s downtrend will be negated because the crypto will have formed a higher low above the May 12 low-of-day.
- If Dogecoin closes the 24-hour trading session near its low-of-day price, the crypto will print a bearish engulfing candlestick, which could indicate the downtrend is still in play and lower prices will come on Tuesday.
- A bounce up higher is likely to happen because Dogecoin’s RSI is measuring in at about 32%. When a stock or crypto’s RSI reaches or falls below the 30% level it becomes oversold, which can be a buy signal for technical traders.
- The drop in Dogecoin’s price on Monday was on lower-than-average volume, which indicates a period of consolidation that bodes well for the bulls. At press time, Dogecoin’s volume was measuring in at about 161 million on Coinbase compared to the 10-day average of 454.08 million.
- Dogecoin has resistance above at $0.099 and at the 12-cent mark and support below at $0.065 and the psychologically important 5-cent level.
 See Also:
 Edge Rankings
Price Trend
© 2025 Benzinga.com. Benzinga does not provide investment advice. All rights reserved.
Trade confidently with insights and alerts from analyst ratings, free reports and breaking news that affects the stocks you care about.

