Zinger Key Points
- Dogecoin’s relative strength index (RSI) has been hovering between about 25% and 35% since May 11.
- The Doge chart has also developed bullish divergence, which indicates a bounce is likely.
- Feel unsure about the market’s next move? Copy trade alerts from Matt Maley—a Wall Street veteran who consistently finds profits in volatile markets. Claim your 7-Day free trial now.
Dogecoin DOGE/USD was trading mostly flat on Tuesday in a generally sideways trading pattern that has plagued traders and investors since May 13 and sucked the enthusiasm out of traders who are used to playing the crypto’s more-usual volatility.
Unfortunately, when Dogecoin fell to its low-of-day at the 8-cent mark, the crypto formed a lower low on the chart, which indicates the downtrend is still intact.
A downtrend occurs when a stock consistently makes a series of lower lows and lower highs on the chart.
The lower lows indicate the bears are in control, while the intermittent lower highs indicate consolidation periods.
Traders can use moving averages to help identify a downtrend, with descending lower timeframe moving averages (such as the eight-day or 21-day exponential moving averages) indicating the stock is in a steep shorter-term downtrend and descending longer-term moving averages (such as the 200-day simple moving average) indicating a long-term downtrend.
A stock often signals when the lower low is in by printing a reversal candlestick such as a doji, bullish engulfing or hammer candlestick. Likewise, the lower high could be signaled when a doji, gravestone or dragonfly candlestick is printed. Moreover, the lower lows and lower highs often take place at resistance and support levels.
In a downtrend the "trend is your friend" until it’s not and in a downtrend, there are ways for both bullish and bearish traders to participate in the stock:
- Bearish traders who are already holding a position in a stock can feel confident the downtrend will continue unless the stock makes a higher high. Traders looking to take a position in a stock trading in a downtrend can usually find the safest entry on the lower high.
- Bullish traders can enter the trade on the lower low and exit on the lower high. These traders can also enter when the downtrend breaks and the stock makes a higher high indicating a reversal into an uptrend may be in the cards.
Want direct analysis? Find me in the BZ Pro lounge! Click here for a free trial.
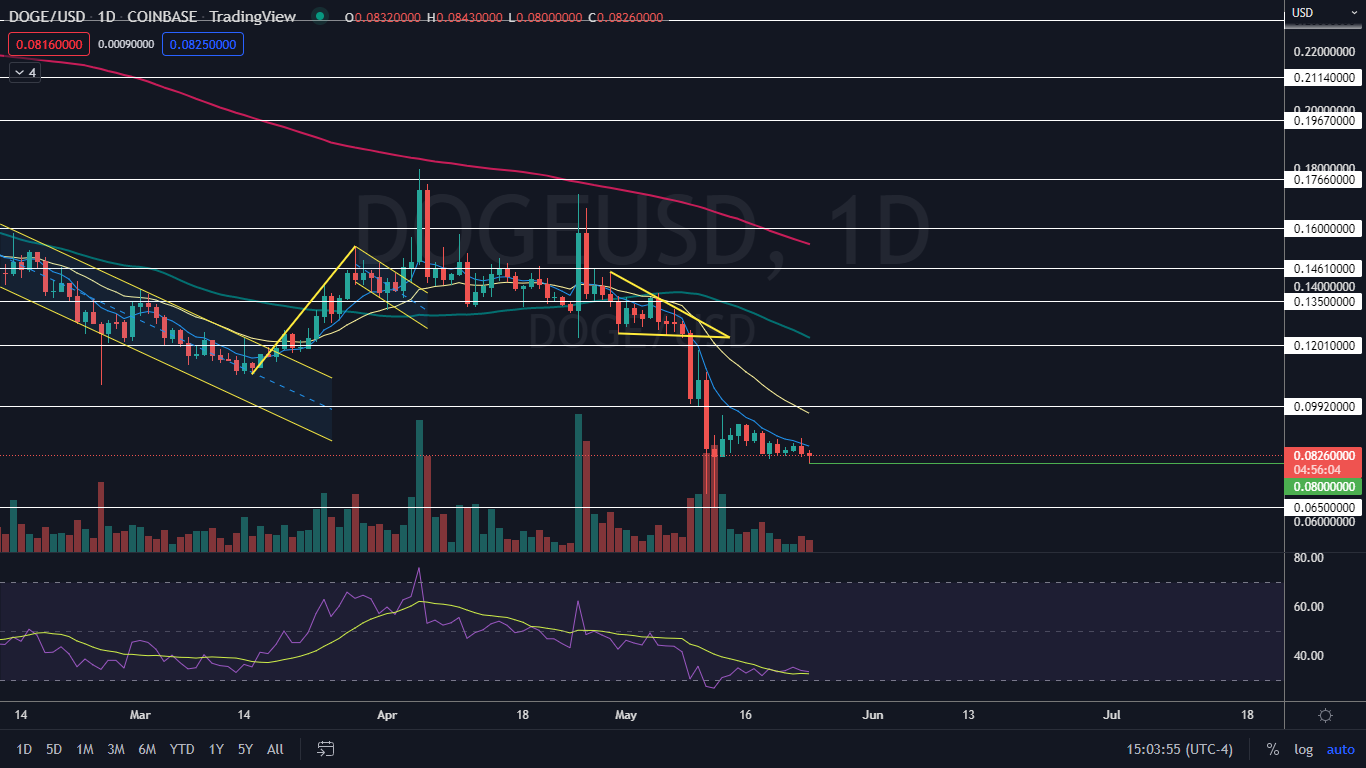
The Dogecoin Chart: Dogecoin’s most recent lower high was printed at the $0.088 level on Monday, and the most recent confirmed lower low was printed on May 19 at $0.081. Even though Dogecoin printed a lower low on Tuesday, the crypto didn’t receive much in terms of momentum, which caused bullish traders to buy the dip.
- At press time, Dogecoin looked to be working to print a hammer candlestick, which could indicate a bounce to the upside is in the cards for Wednesday. If the crypto closes the trading day near its low-of-day price, however, Dogecoin will print a bearish Marubozu candlestick, which could indicate lower prices are on the way.
- A bounce to the upside is the most likely scenario because Dogecoin’s relative strength index (RSI) has been hovering between about 25% and 35% since May 11. When a stock or crypto’s RSI nears or falls below the 30% level, it becomes oversold, which can be a buy signal for technical traders.
- Dogecoin has also developed bullish divergence on its chart, which indicates a bounce is likely. Bullish divergence occurs when a stock or crypto makes a series of lower lows, but the RSI makes a series of higher lows.
- Due to Dogecoin’s tight trading range, if the bullish divergence corrects, it is possible the crypto will make a higher high and negate the downtrend. Bullish traders will want to see Dogecoin paw its way up above the eight-day exponential moving average on the daily chart for more confidence going forward.
- Bearish traders want to see Dogecoin continue to reject the eight-day EMA, which has been guiding the crypto lower since May 5. If the eight-day continues to push the crypto under the 8-cent level, which has so far acted as strong support, a move back towards the May 12 low of 6 cents could be on the horizon.
- Dogecoin has resistance above at 10 cents and the 12- cent mark, and support below at 8 cents and 6 cents.

See Also: Dogecoin Daily: Price Slumps Again, Declining Trader Sentiment And More
Photo: Created with an image from Orde Saunders on Flickr
© 2025 Benzinga.com. Benzinga does not provide investment advice. All rights reserved.
Trade confidently with insights and alerts from analyst ratings, free reports and breaking news that affects the stocks you care about.