


Zinger Key Points
- On the bright side, Dogecoin’s relative strength index (RSI) has been steadily increasing.
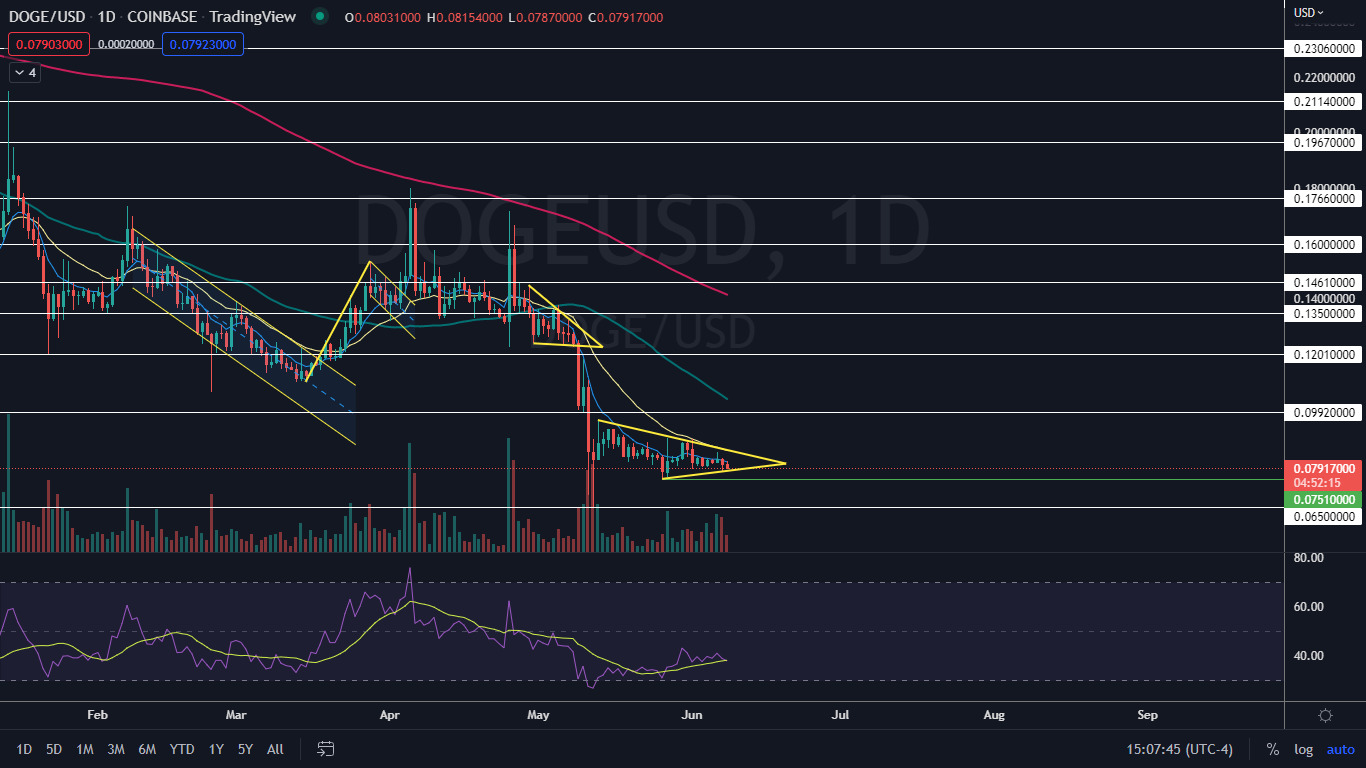
- Dogecoin has resistance above near 10 cents and the 12-cent mark and support below at $0.075 and $0.065.
- China’s new tariffs just reignited the same market patterns that led to triple- and quadruple-digit wins for Matt Maley. Get the next trade alert free.
Dogecoin DOGE/USD was trading mostly flat on Wednesday after a slightly volatile 24-hour session dropped the crypto about 5% lower at one point on Tuesday.
The crypto has been in a long period of consolidation, barely moving for the better part of a month, and could be setting up a symmetrical triangle pattern on the daily chart.
A symmetrical triangle pattern is created when a stock forms a series of lower highs and higher lows between a descending and an ascending trendline, which meet on the right side of the chart to form an apex. The pattern indicates that the bulls and bears are equally in control.
A symmetrical triangle is often formed on lower-than-average volume and demonstrates a decrease in volatility, indicating consolidation. The decreasing volume is often followed by a sharp increase in volume when the stock breaks up or down from the pattern, which should happen before the stock reaches the apex of the triangle.
- Aggressive bullish traders may choose to purchase a stock in a symmetrical triangle when the security reverses course on the lower ascending trendline, with a stop set if the stock rejects at the upper descending trendline of the pattern. More conservative traders may wait for the stock to break up bullishly from the pattern on higher-than-average volume.
- Aggressive bearish traders may choose to trade opposite to the bulls, entering into a short position on a rejection of the upper descending trendline and covering the position if the stock finds support at the lower trendline. Opposite to the bulls, conservative bearish traders may wait for the stock to break down from the lower trendline on higher-than-average bearish volume.
Want direct analysis? Find me in the BZ Pro lounge! Click here for a free trial.
The Dogecoin Chart: Dogecoin began trading in the triangle pattern on May 26, but has been rejecting the upper descending trendline of the pattern since May 13. The crypto is set to reach the apex of the triangle on June 20 and traders and investors can watch for Dogecoin to break up or down from the triangle on higher-than-average volume on or before that date to gauge the future direction.
- Within the triangle, Dogecoin is trading in a slight downtrend, with the most recent lower high printed on Monday at $0.084 and the most recent lower low formed at the $0.077 mark on Tuesday. The downtrend is taking place on lower-than-average volume, however, which aligns with the triangle pattern and confirms consolidation.
- As of press time, Dogecoin’s trading volume on Coinbase was measuring in at about 196.33 million compared to the 10-day average of 269.76 million. Lower-than-average volume not only indicates consolidation but also a lack of interest.
- On the bright side, Dogecoin’s relative strength index (RSI) has been steadily increasing, making a series of higher lows since May 12. An increasing RSI indicates momentum may be returning, but the oscillator is more reliable when paired with other bullish signals or patterns.
- Dogecoin has resistance above near 10 cents and the 12-cent mark and support below at $0.075 and $0.065.
 See Also: If You Had $10,000, Would You Put It On Bitcoin, Ethereum Or Dogecoin Right Now?
Edge Rankings
Price Trend
© 2025 Benzinga.com. Benzinga does not provide investment advice. All rights reserved.
Trade confidently with insights and alerts from analyst ratings, free reports and breaking news that affects the stocks you care about.

