Zinger Key Points
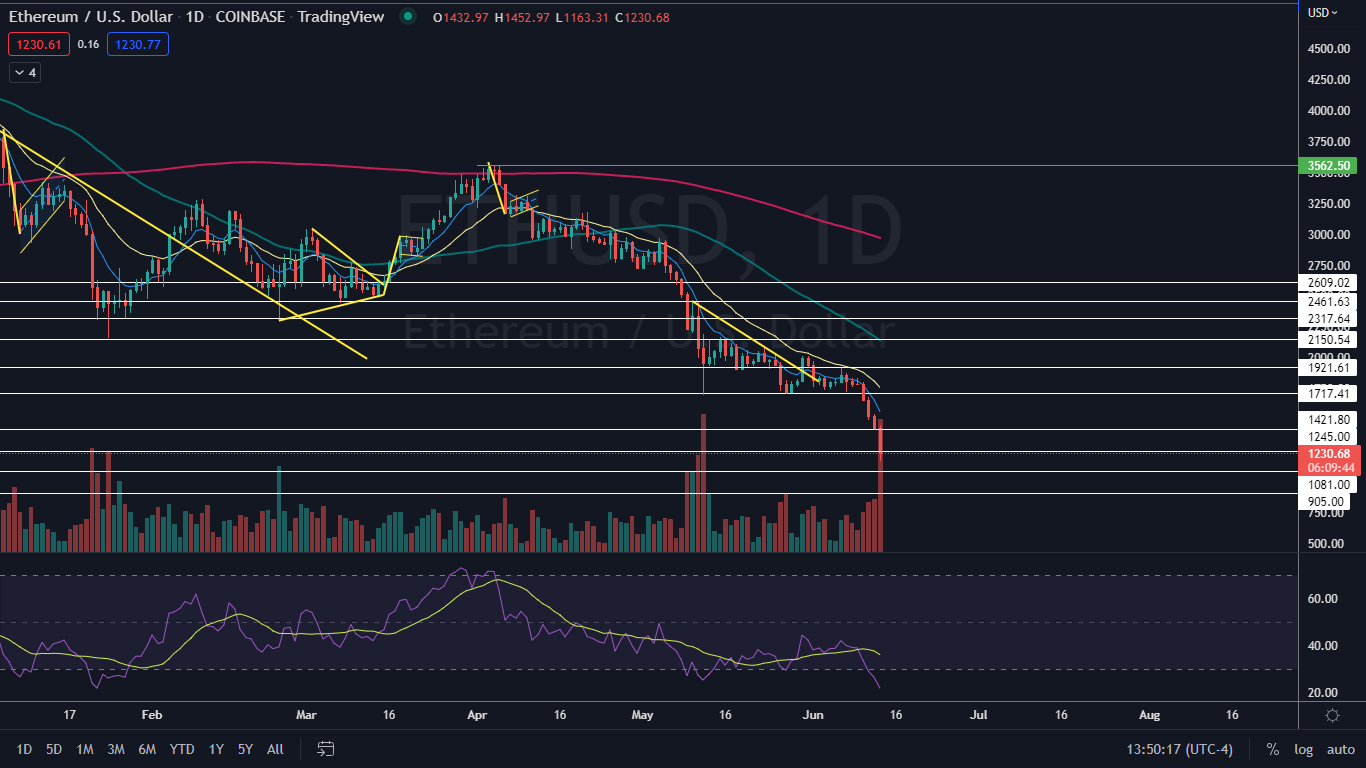
- Ethereum has been trading in a fairly consistent downtrend since April 5, with the most recent lower low of $1,725 formed on June 7.
- The crypto has resistance above at $1,245 and $1,421 and support below at $1,085 and $905.
- Today's manic market swings are creating the perfect setup for Matt’s next volatility trade. Get his next trade alert for free, right here.
Ethereum ETH/USD plunged more than 15% on Monday, which Benzinga pointed out was likely to happen on Saturday if the crypto lost the $1,500 level as support.
News late Sunday night that crypto trading platform Celsius had decided to halt withdrawals, swaps and transfers between accounts, spooked investors who likely began to liquidate positions across similar exchanges out of fear more platforms may follow suit, contributing to the overall sector decline.
Celsius operates on the Ethereum network and the company’s decision to restrict trading on its app appears to have accelerated the crypto's decline.
Although the overall trend for Ethereum, and many other cryptos, is bearish, a bounce to the upside is due to come over the next few days because Ethereum is in need of a lower high in its downtrend.
Want direct analysis? Find me in the BZ Pro lounge! Click here for a free trial.
The Ethereum Chart: Ethereum has been trading in a fairly consistent downtrend since April 5, with the most recent lower low of $1,725 formed on June 7 and the most recent lower high within the pattern created at $1,832.31 two days later. Since then, Ethereum has declined more than 32% without printing another lower high.
- A bounce up to form a leg up in the downtrend is likely to come soon because on Monday, Ethereum’s relative strength index (RSI) plunged to the 22% level. When a stock or crypto’s RSI reaches or falls below the 30% level it becomes oversold, which can be a buy signal for technical traders.
- The move lower came on much higher-than-average volume, which indicates extreme fear has hit the crypto. As of press time, Ethereum’s volume on Coinbase was measuring in at about 775,000 compared to the 10-day average of 228,257.
- If Ethereum closes the 24-hour trading session at its low-of-day price, the crypto will print a bearish Marubozu candlestick, which could indicate lower prices will come again on Tuesday. If the crypto is able to bounce up to close the trading session with a lower shadow, the crypto may print a hammer candlestick, which could indicate a bounce is in the cards.
- The crypto has resistance above at $1,245 and $1,421 and support below at $1,085 and $905, with $1,000 being a key psychological level the bulls don’t want to see lost. A loss of $1,000 could cause a heightened level of fear that could throw the crypto into an even sharper freefall.
 See Also: Is This A Crypto Winter? Why Bitcoin Must Hold $22,600
Photo: Hi my name is Jacco via Ethereum
Edge Rankings
Price Trend
© 2025 Benzinga.com. Benzinga does not provide investment advice. All rights reserved.
Trade confidently with insights and alerts from analyst ratings, free reports and breaking news that affects the stocks you care about.