Zinger Key Points
- Bitcoin and Ethereum have printed triple bottom and double bottom patterns, respectively.
- Both cryptos have also developed exaggerated bullish divergence on their daily charts.
- Get Pro-Level Earnings Insights Before the Market Moves
Bitcoin BTC/USD and Ethereum ETH/USD were trading higher by over 2% and 7%, respectively on Thursday, compared to the S&P 500, which closed down slightly under Wednesday’s closing price. Recently, the cryptocurrency sector has followed the stock market, but on Thursday it appeared Bitcoin and Ethereum could be leading the market higher.
The two apex cryptocurrencies have been trading sideways in a consolidation pattern since June 14 but on fairly high volume, which indicates there is still a fair share of interest in the sector.
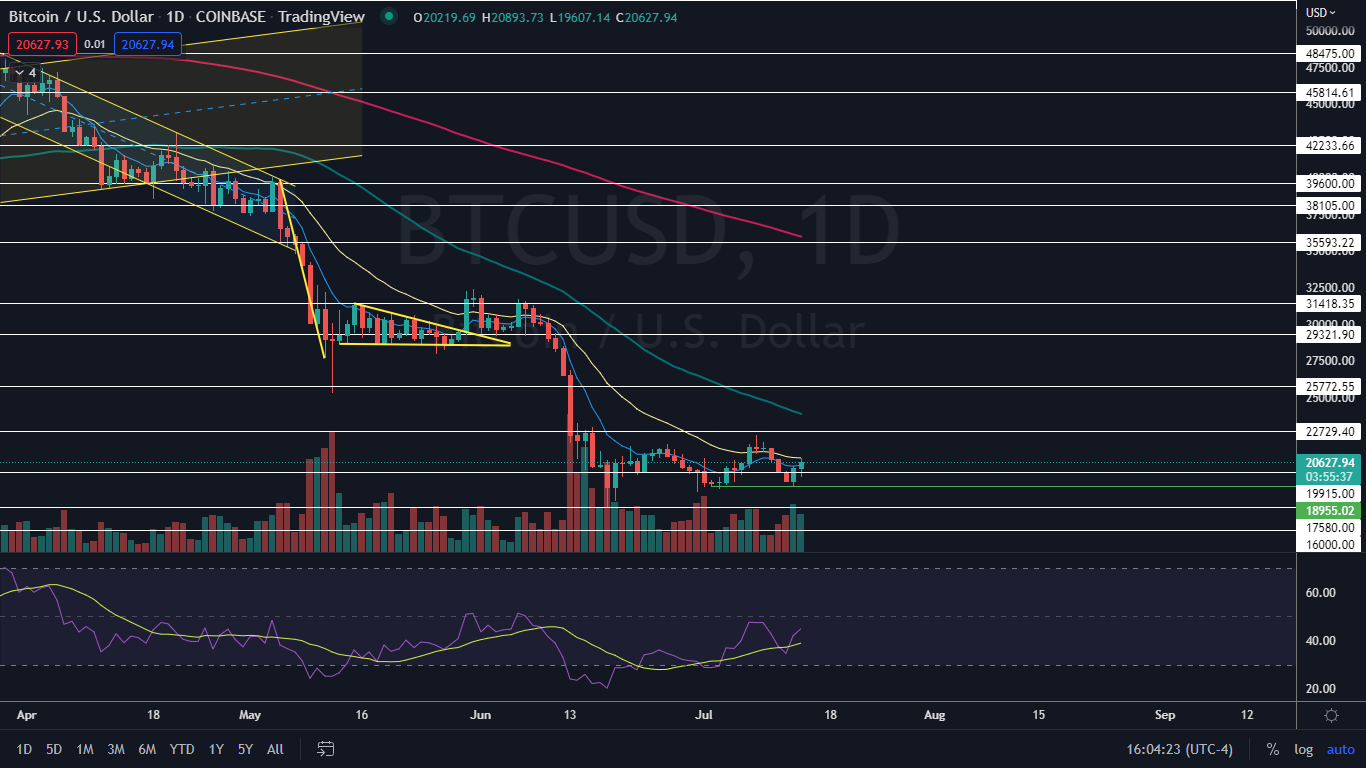
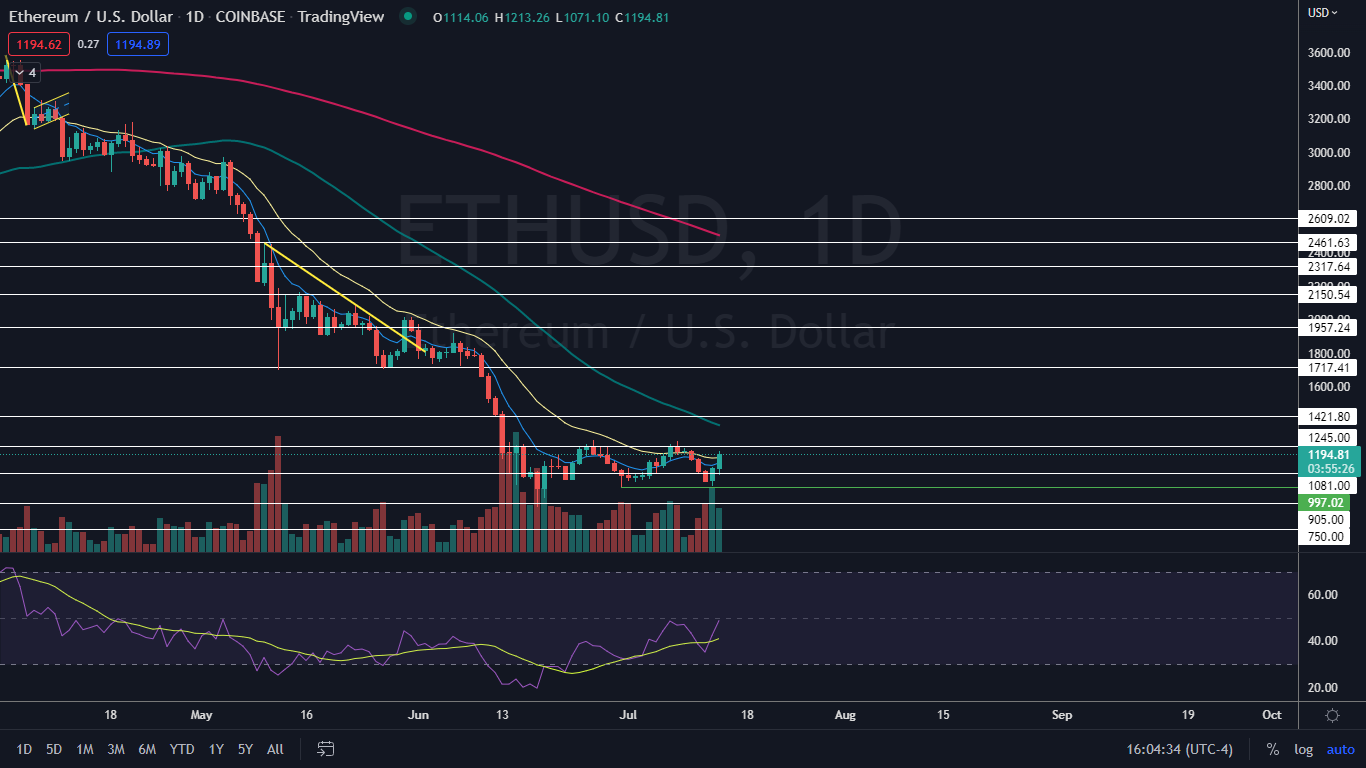
The increase in Bitcoin and Ethereum’s chart could due to a reaction to a triple and double bottom pattern, respectively, that has developed on their charts.
A double bottom pattern is a reversal indicator that shows a stock has dropped to a key support level, rebounded, back tested the level as support and is likely to rebound again. It is possible the stock may retest the level as support again creating a triple bottom or even quadruple bottom pattern.
The formation is always identified after a security has dropped in price and is at the bottom of a downtrend whereas a bearish double top pattern is always found in an uptrend. A spike in volume confirms the double bottom pattern was recognized and subsequent increasing volume may indicate the stock will reverse into an uptrend.
- Aggressive bullish traders may choose to take a position when the stock’s volume spikes after the second retest of the support level. Conservative bullish traders may wait to take a position when the stock’s share price has surpassed the level of the initial rebound (the high before the second bounce from the support level).
- Bearish traders may choose to open a short position if the stock rejects at the level of the first rebound or if the stock falls beneath the key support level at which it created the double bottom pattern.
- It should be noted that as well as forming the double and triple bottom patterns, Bitcoin and Ethereum have both developed exaggerated bullish divergence on their charts. Bullish divergence occurs when a stock’s lows are flat but the relative strength index prints a series of higher lows.
Want direct analysis? Find me in the BZ Pro lounge! Click here for a free trial.
The Bitcoin Chart: Bitcoin formed a triple bottom pattern on June 2, June 3 and Wednesday, and the spike higher on Thursday could indicate the pattern was recognized.
If Bitcoin closes the trading session near its high of day price, the crypto will print a hammer candlestick, which could indicate higher prices will come again on Friday. Bullish traders would like to see Bitcoin close the 24-hour trading session above the 21-day exponential moving average (EMA) for more confidence going forward.
 The Ethereum Chart: Ethereum formed a double bottom pattern on June 30 and Wednesday and, like Bitcoin, may be reacting to the formation. Unlike Bitcoin, Ethereum regained the 21-day EMA and if the crypto can remain above the level, the eight-day EMA will cross above the two-day, which would be bullish.
© 2025 Benzinga.com. Benzinga does not provide investment advice. All rights reserved.
Trade confidently with insights and alerts from analyst ratings, free reports and breaking news that affects the stocks you care about.
 See Also: