
Zinger Key Points
- Ethereum completed its long-awaited merge on Thursday, transitioning to proof-of-stake.
- The crypto suffered a bearish reaction to "The Merge," breaking down bearishly from an inside bar pattern on the daily chart.
- Get access to your new suite of high-powered trading tools, including real-time stock ratings, insider trades, and government trading signals.
Ethereum ETH/USD successfully completed its merge early Thursday morning, transiting from proof-of-work to proof-of-stake.
The move spells the end of Ethereum mining, which makes the crypto far more environmentally friendly. The PoS system may also eventually make Ethereum more cost-effective and easier to validate, which would drop the crypto’s notoriously high transaction costs.
In terms of price action, Ethereum appears to have suffered a bearish reaction to the completion of the merge, with the crypto breaking down bearishly from an inside bar pattern on the daily chart.
An inside bar pattern indicates a period of consolidation and is usually followed by a continuation move in the direction of the trend.
An inside bar pattern has more validity on larger time frames (four-hour chart or larger). The pattern has a minimum of two candlesticks and consists of a mother bar (the first candlestick in the pattern) followed by one or more subsequent candles. The subsequent candle(s) must be completely inside the range of the mother bar and each is called an "inside bar."
A double, or triple inside bar can be more powerful than a single inside bar. After the break of an inside bar pattern, traders want to watch for high volume for confirmation the pattern was recognized.
Bullish traders will want to search for inside bar patterns on stocks that are in an uptrend. Some traders may take a position during the inside bar prior to the break while other aggressive traders will take a position after the break of the pattern.
For bearish traders, finding an inside bar pattern on a stock that's in a downtrend will be key. Like bullish traders, bears have two options of where to take a position to play the break of the pattern. For bearish traders, the pattern is invalidated if the stock rises above the highest range of the mother candle.
Want direct analysis? Find me in the BZ Pro lounge! Click here for a free trial.
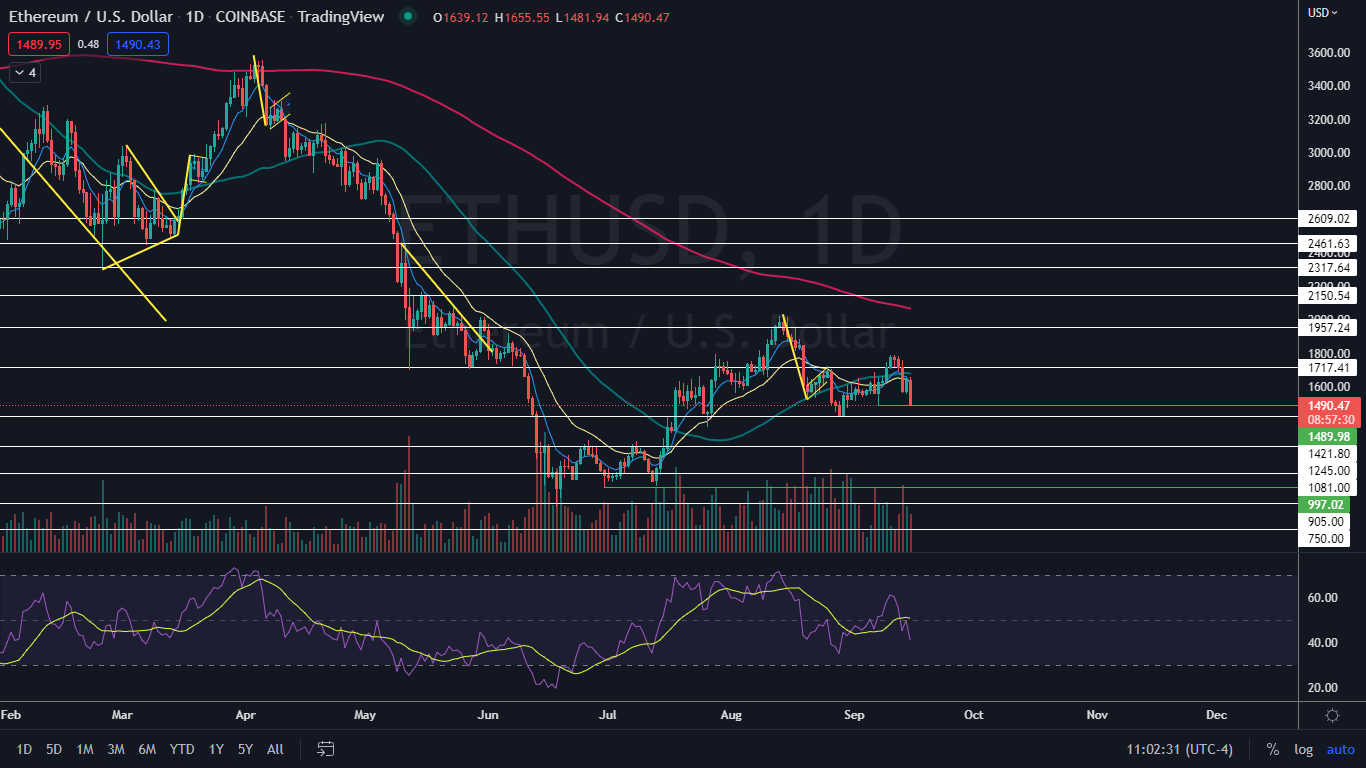
The Ethereum Chart: Ethereum formed an inside bar pattern during Tuesday and Wednesday’s 24-hour trading session, with all of Wednesday’s price action taking place within the previous day’s trading range. The pattern leaned bearish because Wednesday’s inside bar was formed at the lower range of Tuesday’s mother bar.
- The break down from the inside bar pattern was taking place on higher-than-average volume, which indicates the pattern was recognized.
- By late Thursday morning, Ethereum had plunged almost 9% and was testing the Sept. 7 low-of-day as support. If Ethereum falls significantly under the Sept. 7 low of about $1,480, Ethereum’s uptrend will be negated, and a downtrend may confirm over the coming trading days.
- If Ethereum closes the trading session near its low-of-day, the crypto will print a bearish Marubozu candlestick, which could indicate lower prices will come again during Friday’s session. If the crypto bounces up to form a lower wick, a hammer candlestick could form, which could indicate a bounce is in the cards.
- If Ethereum wicks up from the $1,480 level, the crypto may print a double bottom pattern, which could be bullish for the weekend.
- Ethereum has resistance above at $1,717,41 and $1,957.24 and support below at $1,421.80 and $1,245.
 See Also: Why is the Ethereum Merge Important?
© 2025 Benzinga.com. Benzinga does not provide investment advice. All rights reserved.
Trade confidently with insights and alerts from analyst ratings, free reports and breaking news that affects the stocks you care about.

