Zinger Key Points
- Bitcoin is trading in a double inside bar pattern to consolidate prior to the Fed's 2:00 p.m. decision on Wednesday.
- Volatility is likely to increase across the crypto sector and the general markets after the current consolidation period.
Bitcoin BTC/USD was trading almost 2% lower during Wednesday’s 24-hour session after closing Tuesday’s session under the $19,000 mark.
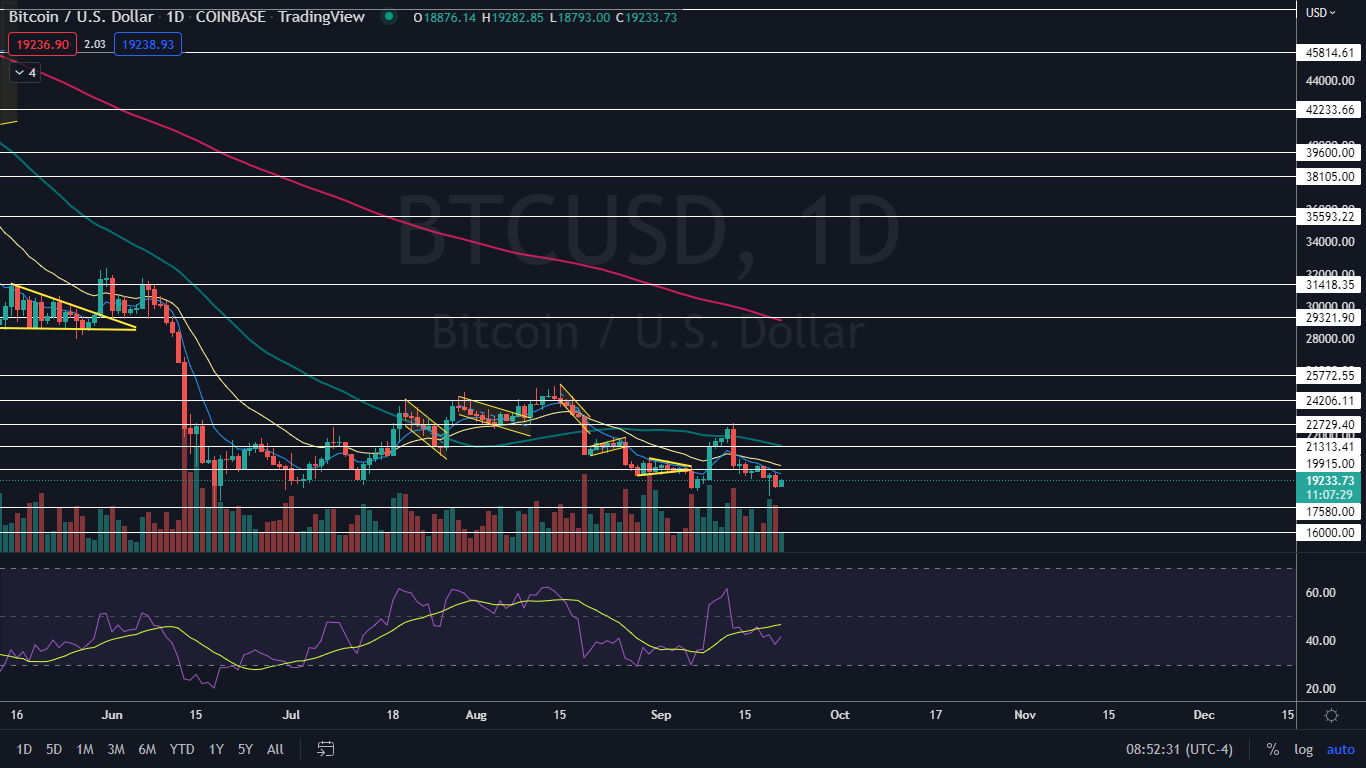
Despite slight volatility over the past two trading sessions, all of Tuesday and Wednesday’s price action has been taking place within Monday’s range, settling Bitcoin into a double inside bar pattern.
An inside bar often indicates consolidation is taking place. Bitcoin’s consolidation is likely in anticipation of the Federal Reserve’s upcoming decision on how high to hike interest rates, expected on Wednesday at 2 p.m. EDT.
Consumer price index data released by the U.S. Labor Department last week showed inflation remained elevated above expectations in August, despite four separate rate hikes initiated in March, May, June and July. The news brought fear that the Fed could hike rates by 0.75% or even by a full percentage point later this week.
Following the decision, Bitcoin — and the stock market’s — volatility may increase. Bitcoin's further direction, at least for the shorter term, will likely become known. It should be noted, the initial reaction on smaller time frames can be a “fake out,” and traders should exercise patience.
Once Bitcoin chooses its direction, which will likely be in tandem with the S&P 500, the rest of the crypto market is likely to follow suit.
Want direct analysis? Find me in the BZ Pro lounge! Click here for a free trial.
The Bitcoin Chart: Bitcoin’s double inside bars technically lean bearish because the crypto was trading lower before forming the pattern. The Fed’s decision is a wildcard, however, which could cause the crypto to break up or down from the pattern.
- If Bitcoin breaks up bullishly from the inside bar pattern, the crypto will regain the eight-day and possibly the 21-day EMAs as support, which would give bullish traders more confidence going forward. If the crypto is unable to regain the indicators as support, the eight-day EMA may continue to push Bitcoin lower.
- Bitcoin started trading in a downtrend on Sept. 13 and has made a consistent series of lower highs and lower lows. Bitcoin’s most recent lower high was formed on Sept. 17 at $20,183 and the most recent lower low was printed at the $18,255 level on Monday.
- Bitcoin has resistance above at $19,915 and $21,313 and support below at $17,580 and $16,000.

Photo: Courtesy of Brookings Institution on flickr
© 2025 Benzinga.com. Benzinga does not provide investment advice. All rights reserved.
Trade confidently with insights and alerts from analyst ratings, free reports and breaking news that affects the stocks you care about.